Oxygen isotopic ratios of 18O/17O in molecular clouds with different Galactocentric distance
2020-08-03 07:02:58ZHANGJiangshuiYUHongzhiLIUWeiYANYaotingCHENJialiangWANGYouxin
廣州大學(xué)學(xué)報(自然科學(xué)版) 2020年1期
關(guān)鍵詞:責(zé)任編輯
ZHANG Jiang-shui, YU Hong-zhi, LIU Wei, YAN Yao-ting, CHEN Jia-liang, WANG You-xin
(Center for Astrophysics, Guangzhou University, Guangzhou 510006, China)
Abstract: The interstellar isotope ratio of 18O/17O can reflect the relative amount of the secular enrichment by ejecta from high-mass versus intermediate-mass stars. We present observations of C18O and C17O J=2-1 lines toward 17 star forming regions with different galactocentric distances through James Clerk Maxwell (JCMT-15m) telescope. Our sources cover the galactocentric distance range of 1-16 kpc. Among them, 11 targets were detected with both C18O and C17O lines. Our analysis results show an obvious radial gradient of 18O/17O along the galactic disk, which was proposed from J=1-0 spectral line observations. However, the isotope ratios of 18O/17O derived from J=2-1 lines are smaller than the J=1-0 ratio in general. This may be caused by more optically thick effect of C18O J=2-1, with respect to its J=1-0 line. It reflects further that the optical depth effect toward our molecular clouds couldn’t be ignored, to determine accurate abundance ratio. Further observations for multi-transition lines of C18O and C17O toward a large sample are important to determine accurately this radial gradient. The more precise the 18O/17O gradient determination, the tighter the constraints we can impose on the synthesis of CNO isotopes.
Key words: CO; isotope; abundance ratio; Galacocentric distance
0 Introduction
Galactic isotope abundance ratios are very important for understanding of stellar nucleosynthesis, stellar ejecta and further formation and chemical evolution of the Milky Way[1]. It can be derived via the intensity ratios of corresponding molecular lines.
18O is believed to be primarily synthesized in massive stars (M≥8Msum) by helium burning, while17O should be dominantly ejected from longer-lived intermediate mass stars through carbon-nitrogen-oxygen (CNO) burning in a slower timescale[2]. Thus18O/17O can reflect the relative amount of the secular enrichment by ejecta from high-mass versus intermediate-mass stars. Due to slower production timescale of17O than18O, the ratio18O/17O in the Galactic center (GC) region should be smaller than that in the Galactic disk, assuming inside-out scenario for our Galaxy formation (i.e., GC formation earlier than disk).
The18O/17O ratio is easy to be determined from the C18O/C17O line intensity ratio, because ① both C18O and C17O have similar chemical and excitation properties and tend to be optically thin, and ② oxygen isotopes are not fractionated[3], which is related to the high first ionization potential of oxygen, 13.6 eV. ③ Finally, the intensities of the C18O and C17O lines are in the same order of magnitude, thus the required sensitivities of the observation are not extremely different.
Penzias[4]reported a uniform value about 3.6 of18O/17O from GC molecular clouds to disk molecular clouds with galactocentric distance out to 13 kpc, which is derived from the C18O/C17O line intensity ratio of 14 sources. Wouterloot, et al.[5]reported a possible gradient with increasing18O/17O ratios as a function of the galactocentric distances through observations on C18O and C17O of 18 sources. The ratio increase from ~3.0 in the GC (Sgr B2) to ~5.0 in sources with galactocentric distance out to 16 kpc. Li, et al.[6]reported an apparent18O/17O gradient based on Delingha 13.7 m observations of 14 sources located at different positions in the galactic disk, with the ratio values of 3.01±0.14, 4.35±0.45 and >5.27 for the Galactic center, sources at 3-11 kpc galactocentric distance and source at >11 kpc galactocentric distance, respectively.
However, previous results were based on the J=1-0 transition lines of C18O and C17O. One transition alone is not sufficient for accounting the radiative transfer effect and constraining the opacities, thus more transition lines of isotopes are needed.
Here we present our observations of J=2-1 transitions toward a sample of 17 sources, taken by JCMT-15m telescope operated by East Asian Observatory. Our sample chose sources with different galacocentric distance, especially more sources with large galactocentric distances, since only a few sources with large distance have been detected before. The observations and data process are described in Sect. 2. As shown in Sect. 3, we present the analysis of the data and corresponding discussions. In Sect. 4, we summarize the main result.
1 Observations
The C18O and C17O J =2-1 data were observed with the JCMT in May, 2015 and July, 2016. The observations were carried out in Position-Switch (PS) mode. All spectra were taken with the dual-polarization 1.3 mm RxA3m (212~274 GHz) receiver and the ACSIS spectrometer backends. The spectrometer was operated in the 930 MHz bandwidth (2048 channels) mode, which corresponded to the 488 kHz frequency resolution and velocity resolution of 0.63 km/s.
The main beam efficiency ηmbis 0.65 and the full beam width to half power is about ~20″ at 230 GHz. Typical system noise temperatures during the observations were 150~300 K. The on-source integration time was normally 5 minutes for the C18O line and 20 minutes for C17O line, with a rms of ~ 0.10 K and ~ 0.05 K inTA, respectively. These observation parameters are listed in Table 1.
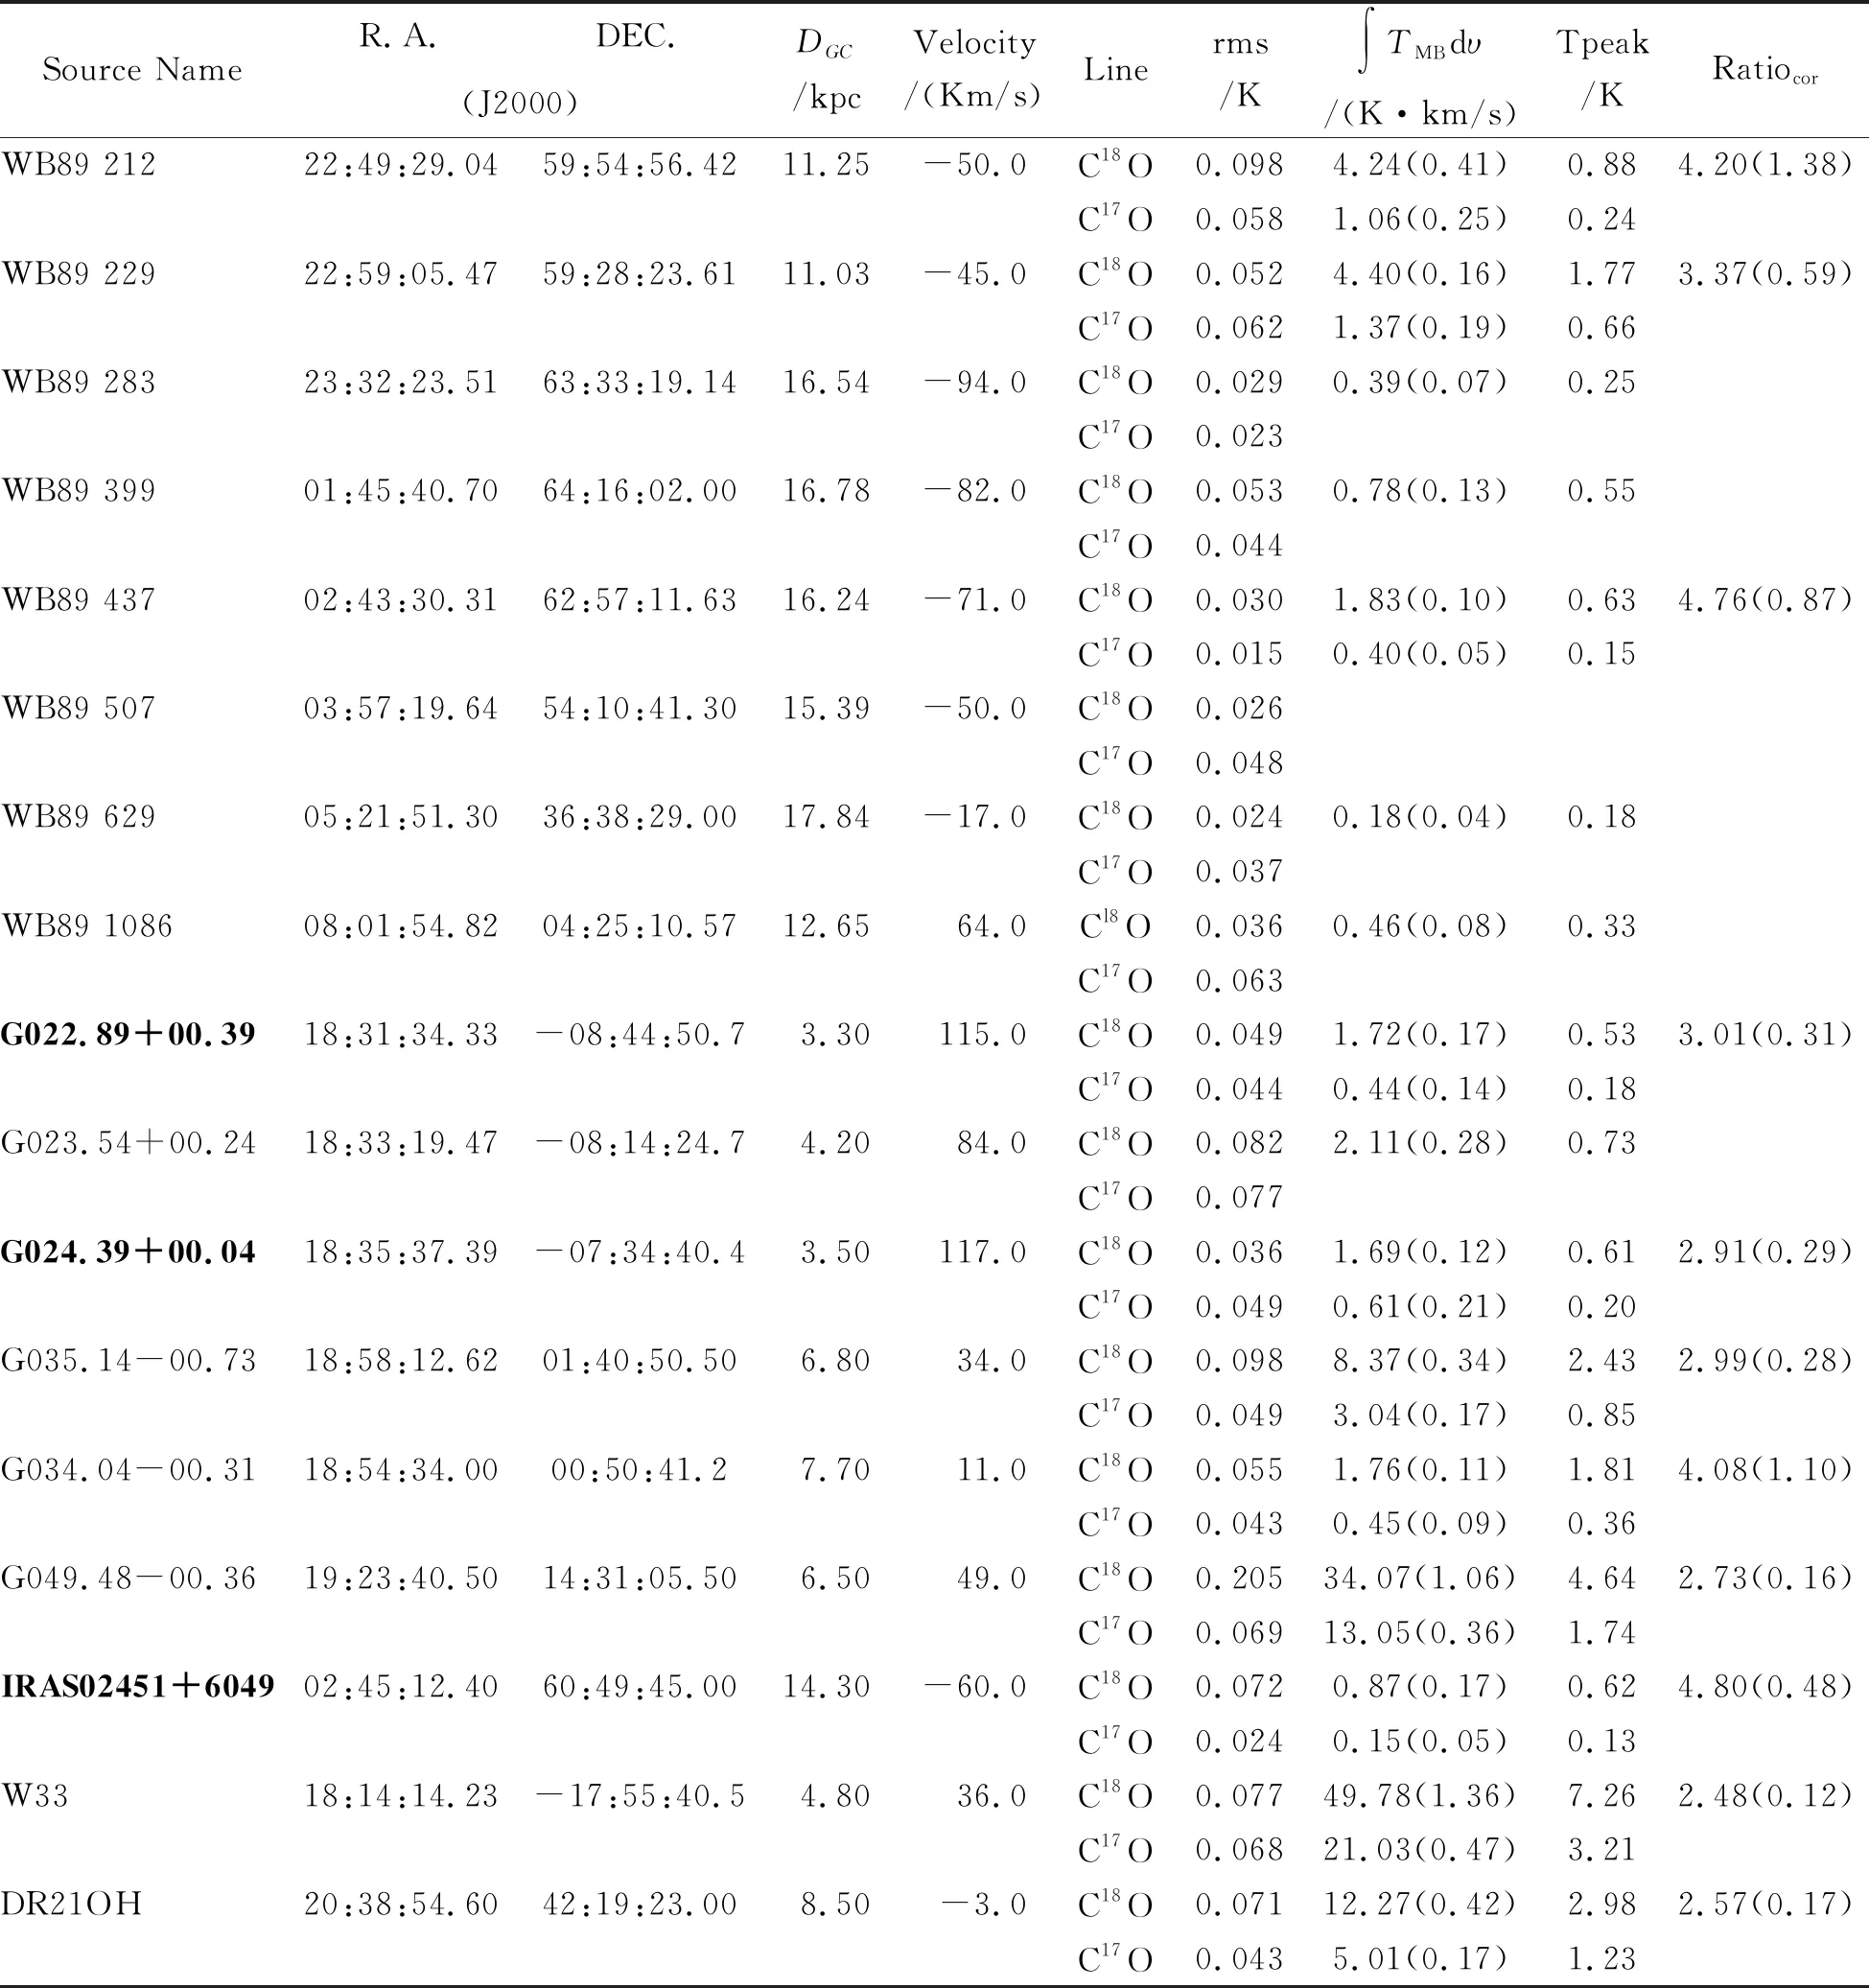
Table 1 18O/17O isotope ratios of our 17 samples of molecular clouds: J=2-1 C18O and C17O observations
Note—Sources with blank values represent those that its C18O or C17O signal was not detected. For the 3 sources (bold font) with low quality C17O spectra (G022.89+00.39, G024.39+00.04, IRAS02451+6049), their abundance ratios were estimated by their peak value ratios, with 10% error. Column ①: source name; Column ② and ③: equatorial coordinates in J2000; Column ④: the galactocentric distance; Column ⑤: the radial velocity of sources; Column ⑥: molecular species; Column ⑦: the Root-Mean-Square (rms) value of spectra lines. Column ⑧: the integrated line intensity of C18O and C17O, with its error in parentheses; Column ⑨: the line peak values; Column ⑩: the frequency-corrected abundance ratio with its error in parentheses.
2 Results & discussion
These data were reduced by using the the SPLAT packages[7]of JCMT data analysis softwareStarklink. A GUI Spectral Analysis Tool that can compare multiple spectra, identify lines, fit and produce plots. The individual spectra were subtracted with the baselines obtained by the first order polynomial. Then Gaussian fitting was performed for observed spectra. All spectra were smoothed to a velocity resolution of about 0.63 km/s. Both C18O and C17O spectra of our sample are presented in Fig.1.
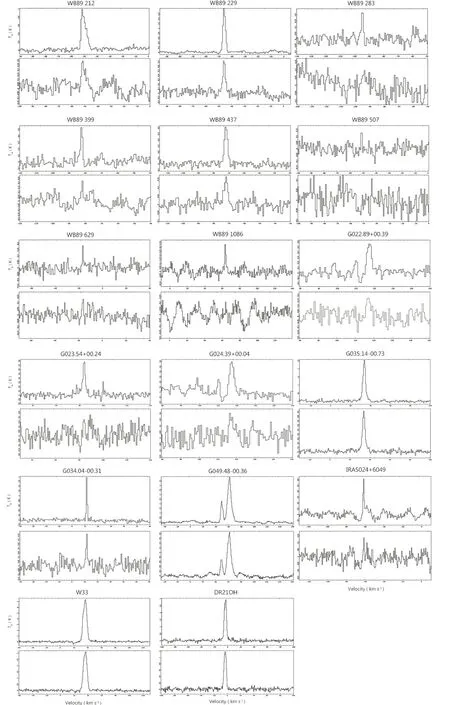
Fig.1 C18O (upper panels) and C17O (lower panels) spectra for our sample, from observations with the JCMT-15m telescope
The fitting result are also listed in Table 1, including the peak value (Tpeak), the integrated intensity with its errors. Since the column density is proportional to the factor ofv-2times the integrated line intensity for clouds filling the beam, the abundance ratio of the two molecules should be equal to the ratio of their integrated line intensities times the correction factor, i.e.,
18O/17O(corrected)=(vC18O/vC17O)2*C18O/C17O[8-9]. The corrected18O and17O abundance ratios with its errors are also show in Table 1 in the last column.
The18O/17O ratio with error are plotted against the galactocentric distance for our sample in the Fig.2 (empty squares).
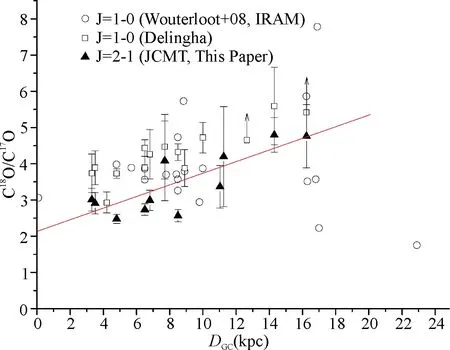
Fig.2 C18O/C17O abundance ratios as a function of the galactocentric distance (DGC)
The triangles show our J=2-1 results, the empty circles and squares represent the J=1-0 results from Wouterloot, et al.[5]and Li, et al.[6].
For comparison, results from Wouterloot, et al.[5]and Li, et al.[6]are also presented in this figure (empty circles and black squares). The trend is obvious, i.e., the ratio18O/17O increasing with the galactocentric distance. The linear least-squares fit shows18O/17O=(0.17±0.04)DGC+(2.0±0.36), with Pearson’s rank correlation coefficient R = 0.64. However, with respect to the ratio results from J=1-0 data, the J=2-1 ratios seem to be generally lower. This should be related to different excitation condition and line opacity of both transitions. With respect to J=1-0 C18O line, the saturation of its J=2-1 line can be more serious, which leads to underestimated abundance ratio of C18O/C17O. This was supported by model calculation results of(2-1) >(1-0)[1].
In order to determine accurately this radial gradient of C18O/C17O in the Galactic ISM, a large sample with observations for multi-transition lines of C18O and C17O are important. The more precise the18O/17O gradient determination from observations, the tighter the constraints our theory models can impose on the synthesis of CNO isotopes, such as, contributions from novae, and/or rotation effect of massive stars[10].
3 Summary
We present our JCMT observations on the J=2-1 lines of C18O and C17O toward a sample of 17 star-forming regions with different distance. Our sample covers a large range of the Galactocentric distance, from the Galactic center to the far-outer galaxy (~16 kpc).
The isotope ratio of18O/17O for our sample is determined from the integrated intensity of observed C18O and C17O lines. The isotope ratio tends to increase with the galactocentric distance, which supports previous results from C18O and C17O J=1-0 data. A least-squares linear fit gives18O/17O=(0.17±0.04)DGC+(2.0±0.36), with Pearson’s rank correlation coefficient R=0.64.
However, the ratios from J=2-1 data appear to be lower than those from J=1-0 data, which should be caused by optically thick of the high-level transition of C18O J=2-1. The saturation of J=2-1 C18O lines is significant, which leads to underestimated abundance ratio of C18O/C17O, which is consistent with the model calculation results.
Further observations for multi-transition lines of C18O and C17O toward a large sample are important to determine accurately this radial gradient18O/17O. The more precise the18O/17O gradient determination, the tighter the constraints we can impose on the synthesis of CNO isotopes, such as, contributions from novae, and/or rotation effect of massive stars.
【責(zé)任編輯: 陳 鋼】
猜你喜歡
暨南學(xué)報(哲學(xué)社會科學(xué)版)(2017年5期)2017-11-14 00:23:58
創(chuàng)意與設(shè)計(2017年3期)2017-07-31 16:30:14
國際稅收(2016年2期)2016-12-29 14:56:25
暨南學(xué)報(哲學(xué)社會科學(xué)版)(2016年12期)2016-11-26 05:34:11
暨南學(xué)報(哲學(xué)社會科學(xué)版)(2016年3期)2016-11-25 21:59:37
暨南學(xué)報(哲學(xué)社會科學(xué)版)(2015年5期)2015-11-14 18:15:43
暨南學(xué)報(哲學(xué)社會科學(xué)版)(2015年2期)2015-11-14 17:30:33
暨南學(xué)報(哲學(xué)社會科學(xué)版)(2015年3期)2015-11-14 13:25:23
暨南學(xué)報(哲學(xué)社會科學(xué)版)(2015年1期)2015-11-14 08:43:56
暨南學(xué)報(哲學(xué)社會科學(xué)版)(2015年6期)2015-11-14 06:59:30