
Effects of CeO2 and nano-ZrO2 agents on the crystallization behavior and mechanism of CaO-Al2O3-MgO-SiO2-based glass ceramics?
2019-08-06 02:07:42YanZhang張艷YuShi石鈺XuefengZhang張雪峰FengxiaHu胡鳳霞JirongSun孫繼榮TongyunZhao趙同云andBaogenShen沈保根
Chinese Physics B 2019年7期
Yan Zhang(張艷), Yu Shi(石鈺), Xuefeng Zhang(張雪峰), Fengxia Hu(胡鳳霞),Jirong Sun(孫繼榮), Tongyun Zhao(趙同云), and Baogen Shen(沈保根),?
1State Key Laboratory of Magnetism,Institute of Physics,Chinese Academy of Sciences,Beijing 100190,China
2University of Chinese Academy of Sciences,Beijing 100049,China
3Key Laboratory of Integrated Exploitation of Bayan Obo Multi-Metal Resources,Inner Mongolia University of Science and Technology,Baotou 014010,China
Keywords: activation energy,orientation,nanocrystalline,diopside
1. Introduction
CaO-Al2O3-MgO-SiO2(CAMS)-based diopside glass ceramics with numerous advantageous physical,chemical,and biological properties have gained huge research interest. Nonami et al. and Miake et al. confirmed that the dense diopside bulks possess good bioactivity and outstanding mechanical properties.[1,2]Porous diopside materials play an important role in bone tissue engineering and drug delivery.[3,4]Glass ceramics containing diopside are also noteworthy for nuclear waste immobilization[5]and as sealing materials in solid oxide fuel cells.[6,7]CAMS-based diopside glass ceramics can also be used as construction materials, pipelines, and sealants for solid fuel cells.[8]
From the perspective of industrial application and environmental protection,the preparation of glass ceramics is undoubtedly of great significance in the use of waste. A small amount of impurity atoms in the raw material can be dissolved into the gap of the crystal phase or the glass network during the growth of the crystalline to avoid excessively affecting material properties; therefore, complex fly ash,[9]metal tailings,and solid waste,[10]such as blast furnace slag,[11]can be used to synthesize CAMS-based glass ceramics.
Diopside is a kind of monoclinic pyroxene (space group C2/c) with a chemical composition of CaMg(SiO3)2and lattice parameters of a = 0.9741 nm, b = 0.8919 nm,c = 0.5257 nm, and β = 105.79°. Diopside crystal grows up through crystallization of the glass as all other glassceramics.[12,13]A suitable nucleation agent is normally added to facilitate crystallization. Thus,the crystallization activation energy Eawill be notably reduced due to heterogeneous nucleation behavior. Adding TiO2or ZrO2into CAMS-based glass ceramics leads to phase segregation during annealing process, which is believed to be the influence of the high electric field strength of Ti4+and Zr4+ions.[12,14]Recognizing that the crystallization temperature decreases as ZrO2content increases,[14,15]homogeneous bulk nucleation is promoted by adding nanoscale nucleating agents to the glass.[16]Glass viscosity will markedly decrease when CeO2is added as a flux.[17]By combining these factors,nanoscale ZrO2nucleating agents and CeO2additive are introduced in this study to investigate their effects on the growth mechanisms, phase assemblages, crystallization behavior, and microstructure of CAMS-based diopside glass ceramics.
2. Experimental procedure
The primary glass composition, as presented in Table 1,is the same for all of the three samples, labeled A, B, and C,respectively. Extra ZrO2nucleating agents with various average grain sizes d, more than 1 μm for sample A and less than 100 nm for samples B and C, were added to the samples. In addition, CeO2of 1.0 mol% was added to sample C solely. Precursor materials of analytically pure powders of CaCO3, MgO, Al2O3, SiO2, B2O3, ZnO, and Na2CO3together with ZrO2and CeO2were mixed in a planetary ball mill, and melted at 1500°C for 1 hour in corundum crucible.The molten mixture was poured into a stainless steel mold of 100 mm×20 mm×4 mm. After solidifying, the glass block was cut into several pieces. A part of the glass pieces were ground into powders by a ball mill and then used for differential scanning calorimeter (DSC) test to determine the heat treatment regime.
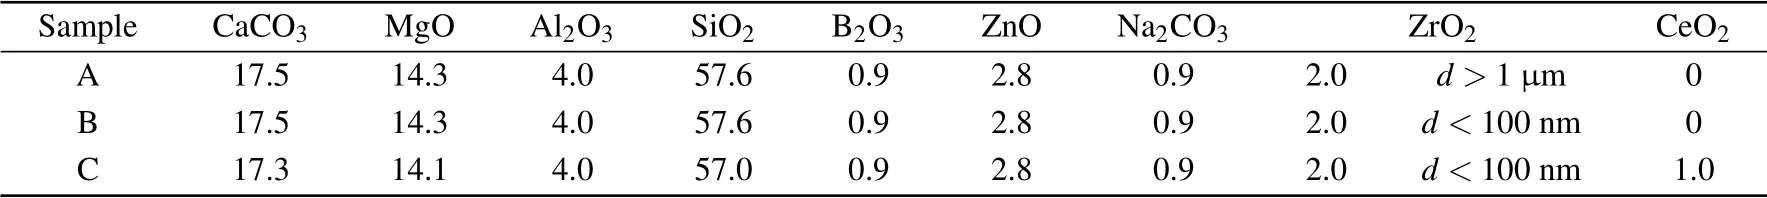
Table 1. Basic ingredients of the CAMS-based glass-ceramics(in the unit of mol%).
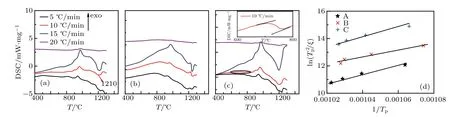
Fig.1.Scanning thermal analysis(DSC)curves of samples(a)A,(b)B,and(c)C in different heating rates.The inset of panel(c)is an enlarged view of the DSC curve at the heating rate of 10 °C/min between 600 °C and 800 °C.(d)ln(T2p/ξ)vs.1/Tp and the corresponding linear fittings(straight lines)of the three samples.
Thermal analysis was carried out in an NETZSCH 449F5 simultaneous thermal analyzer (STA) instrument using glass powders of 20 mg at different heating rates of 5°C/min,10°C/min,15°C/min,and 20°C/min,as shown in Fig.1. The inset of Fig.1(c)is an enlarged view of the DSC curve at the heating rate of 10°C/min between 600°C and 800°C. The glass transition temperature Tgand crystallization peak temperature Tpwere determined to be 700°C and 960°C,respectively, referring to the DSC curves at 10°C/min of the three samples.
Beall et al.suggested that crystal nucleation generally occurs at temperatures 50-100°C above Tg.[18]Therefore,the nucleation temperature in the present work was set to 750°C.Both nucleation and growth treatments were conducted for 2 hours.
The glass ceramics were sliced into sections,polished by a polishing machine and immersed in 10% HF acid for approximately 60 s. The section was sprayed with gold for the electron microscopy observation.
The morphology and chemical compositions of the samples were measured by scanning electron microscopy (SEM,Phenom ProX)equipped with energy disperse x-ray spectrometer (EDS). Further microstructure and orientation identification were carried out by Zeiss Supra55 scanning electron microcopy,which is equipped with an Oxford energy dispersive x-ray spectrometer and HKL electron backscatter diffraction(EBSD)analysis system.
3. Results and discussion
Table 2 lists the temperature parameters derived from Fig.1.The results showed that the values of Tpof both samples B and C are lower than that of sample A,which is consistent with the references previously reported.[14,15]The kinetics of glass crystallization can be described in terms of the Johnson-Mehl-Avrami (JMA) equation.[19,20]The crystallization activation energy is obtained from the relationship between the heating rate ξ and crystallization peak temperature Tp, as described by the Kissinger expression[21,22]

In Eq.(1),R is the molar gas constant(~8.314 J·mol-1·K-1)and vadenotes a dimensionless pre-exponential factor. Figure 1(d) shows the variation of ln(T2p/ξ) vs. 1/Tp, which is linear in nature with the intercept ln(Ea/Rva)and slope Ea/R.The Avrami parameter n can be calculated according to Eaby using the Augis-Bennett equation as follows:[23]
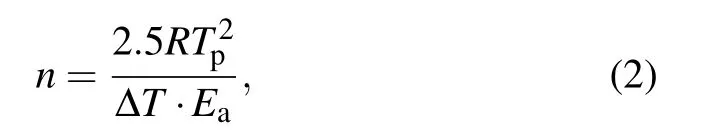
where ΔT is the full width at the half maximum of the crystallization peak.The crystallization kinetic parameters have been listed in Table 3. Sample B exhibits the lowest activation energy Eaof 214 kJ/mol and the highest Avrami index n close to 3,indicating that the refinement of ZrO2nucleating agents favors crystallization and two-dimensional bulk crystal growth.However,Eaincreases after adding the CeO2agent to the basic ingredient as indicated in Table 3 for sample C.In general,the addition of rare-earth oxide to the CAMS-based diopside glass-ceramics has been expected to significantly improve the specific optical or magnetic performances,but the effect of the rare-earth ion on the glass structure and crystalline characteristics has been inconclusive so far.[24]The properties of rareearth oxides mainly depend on the ionic radii of the rare-earth ions.[25,26]We speculate that the low field strength of the large Ce4+ion weakens the cross-linking networks and reduces the ion mobility.[27]
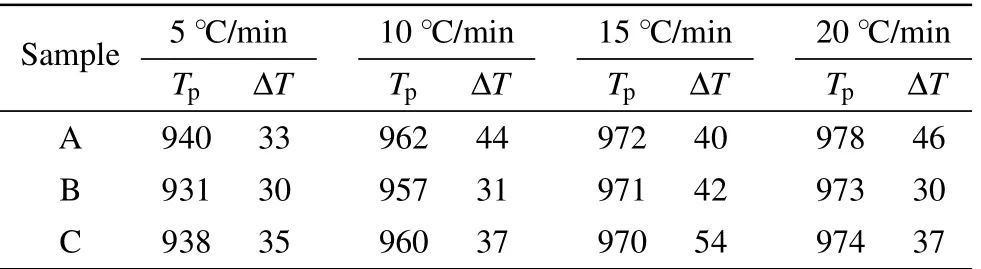
Table 2. Crystallization peak temperature Tp and half width of the crystallization peak ΔT of samples A,B,and C at different heating rates of 5 °C/min,10 °C/min,15 °C/min,and 20 °C/min(in the unit of °C).
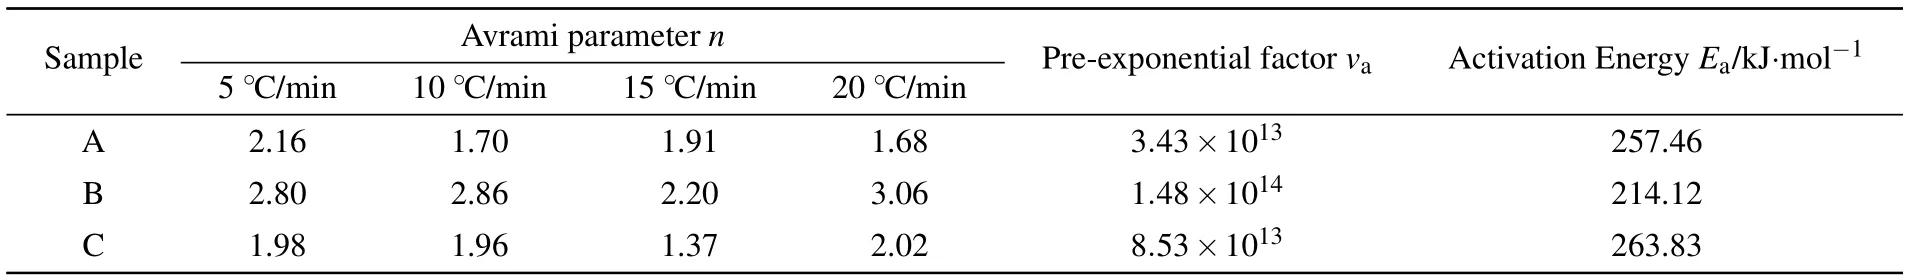
Table 3. Crystallization kinetic parameters of samples A,B,and C.
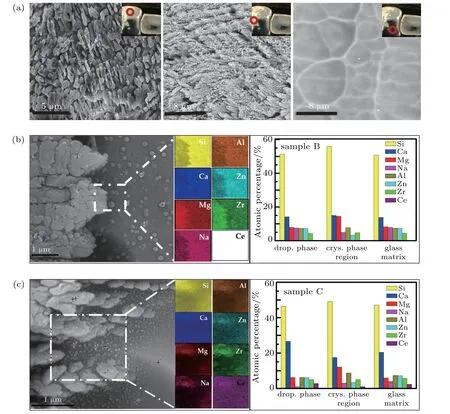
Fig.2. (a)The SEM images of sample A in three different position areas,as indicated by the red circles. (b)and(c)The SEM micrographs of the interface between the crystallization region and the glass matrix of samples B and C;EDS-mappings of different elements correspond to the marked white rectangular boxes;the atomic percentage corresponding to statistical average of the points is indicated by the cross on the SEM image.
The thickness of the crystallized layer is approximately 400μm. The surfaces of heat-treated samples have been polished to remove the deformation of the glass after crystallization. All of the glass blocks show notable delamination after the above heat treatment,so we select different regions marked with red circles for microscopic analysis,as shown in Fig.2(a).The neatly arranged particles suggest a preferred orientation for grain growth. The glass matrix phase showing no grains nor heterophase presents some glass grids. The microscopic topography of samples B and C between the crystal phase and the glass phase is shown in Figs. 2(b) and 2(c). Combining with the EDS results, the small droplets with similar chemical components to those of the glass matrix in sample B are observed homogeneously precipitated in the glass matrix. A similar phenomenon was also mentioned by Enrico et al.[16]These droplets with a particle size of 100-200 nm may act as nuclei to facilitate the crystallization and homogeneous bulk nucleation, as reported in previous literature,[13-16]which is also proven by the previous Avrami index n. The Na+ions that remain in the glass phase cause a reaction with the media due to their high ionic mobility and dispersion tendency.[17]However, several nanoparticles with the lowest concentration of Na+ions are found around the grains in sample C,implying that these nanoparticles with a different composition from droplets phase have probably been nano-crystallized. According to the EDS results, the content of Mg2+ion in crystals is higher than those in other regions because the Mg2+ions have to connect each[Si2O6]4+single chain to constitute the CaMgSi2O6crystalline structure. The lowest atomic percentage of Ce4+is observed in the crystal phase.Hence,rare-earth ions with large ionic radius mainly exist in the glass phase and can weaken the cross-linking networks.
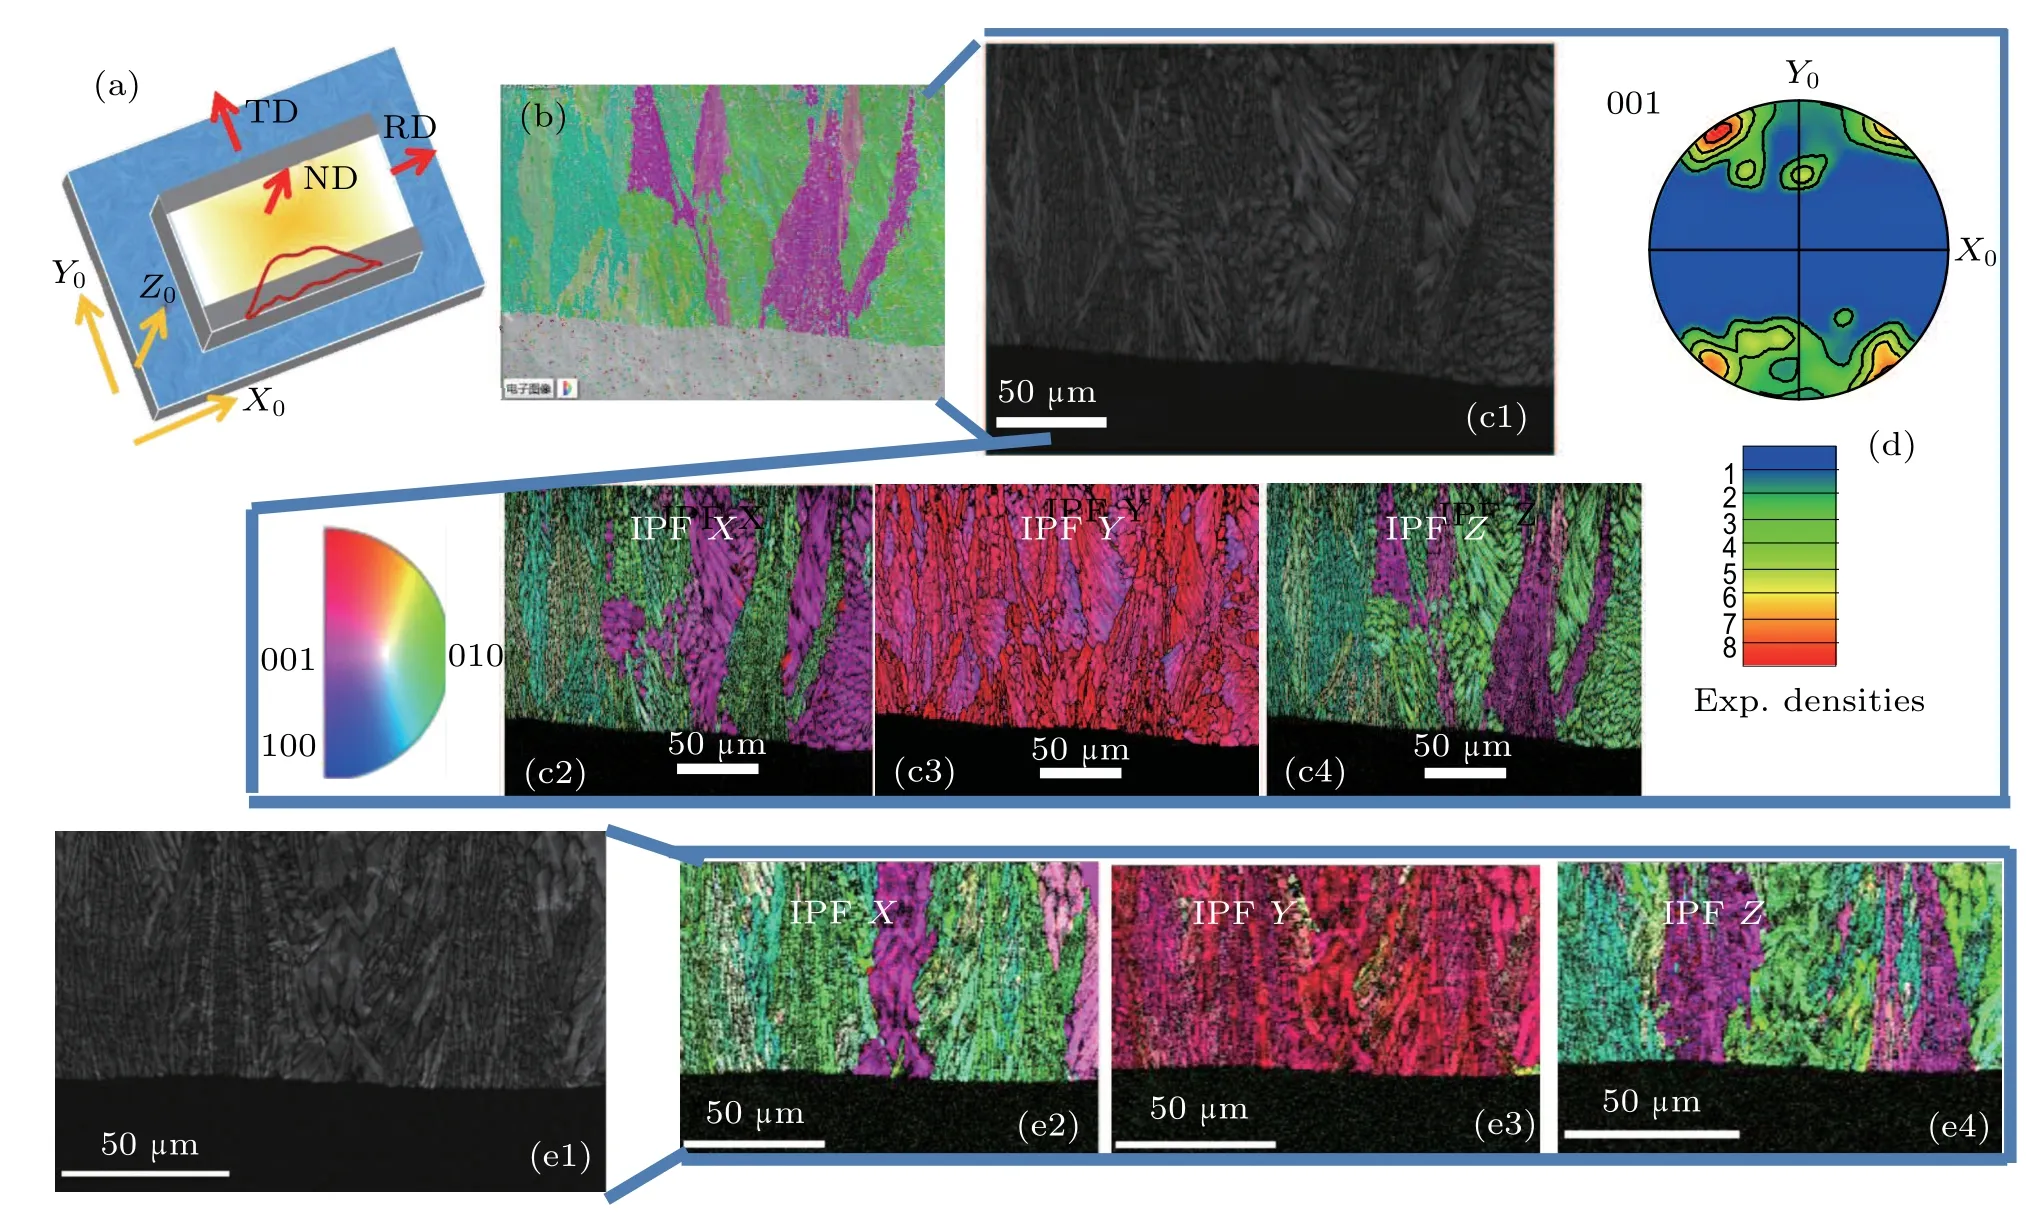
Fig.3. (a)The position of the sample relative to the spatial coordinates. The red solid line area is polished with argon ion. (b)Layered image corresponding to the polished section on the interface of sample A.(c1)Band contrast of the identical area of sample A.(c2)-(c4)Individual IPF-X,IPF-Y,and IPF-Z and(d)001-pole figures. (e1)Band contrast and(e2)-(e4)individual IPF-X,IPF-Y,and IPF-Z of sample B.
To gain insight into specific orientation relationships during growth, the interfaces of the three samples are measured,which have been polished with argon ions under a Zeiss Supra 55 SEM.Figure 3 shows the EBSD orientation mapping of the polished section on the interface of samples A and B.The position of the sample relative to the spatial coordinates is shown in Fig. 3(a). Each sample has been modeled into a regular cube with the inner glass layer shown in yellow and the outer crystal layer in gray, and the red solid line indicates that the area is polished with argon ions. The area of 150×200μm2after polishing is selected for analysis. The direction parallel to the surface is defined as X0, the transition of crystallized layer to the glass layer as Y0, and the normal state of X0Y0plane as Z0. In the stereographic projection, X0‖ rolling direction(RD),Y0‖transverse direction(TD),and Z0‖normal direction(ND).It is clearly observed that this area is divided into two layers according to Fig.3(b). The grains indexed as diopside structure can show more detail through the band contrast of the identical area, as Fig.3(c1)shows. The dark area indicates that there are no grains here. To verify specific orientation relationships during growth, the inverse pole figure(IPF) images are constructed as shown in Figs. 3(c2), 3(c3),and 3(c4). In IPF images,the same color means a specific direction. It is found that most diopside grains grow either pink or green color. Hence, the orientation of all diopside grains can be identified as[001]and[010]. Figure 3(c3)shows that all grains grow pink in color, indicating that the c-axis is increasingly oriented perpendicular to the interface. The 001-pole figure (PF) is also presented to illustrate that the c-axis is more or less perpendicular to the interface. Similar results for sample B compared with sample A are shown based on the band contrast image (Fig. 3(e1)) and individual IPF images(Figs.3(e2)-3(e4)),indicating that the size of the ZrO2nucleating agents has no effect on the preferred orientation of the diopside grains.
Although the delamination structure of sample C is visible,nanocrystals are observed in the layered image(Fig.4(a)),which is different from the results of samples A and B.These nanocrystals bordering the crystal layer can be distinguished according to the orientation map (Fig. 4(b1)). Wire frames of unit cells visualize the crystal orientations at the cross locations.[28]Selected crystal orientations are visualized by the unit cells 1-5. The c-axis of unit cell 1 is perpendicular to the interface,while the unit cells 2,3,4,and 5 illustrate that the c-axes of the respective growth structures are almost parallel to the interface. The individual IPF image shows that green and red colors denote a cluttered distribution in all directions,indicating that the[010]and[001]orientations compete with each other in various spatial directions. However, the IPF-X image shows fully green nanocrystalline area. So we extend the observation area,as the layered image of Fig.4(c)shows.The preferred orientation of nanocrystals is indeed [010] according to the IPF-X image,which indicates that the addition of CeO2agents aids in the formation of nanocrystals preferring the [010] orientation. The 001-PF and 010-PF illustrate that the grains are very weakly distributed on(001)-plane,and parallel to the[010]direction on(010)-plane.
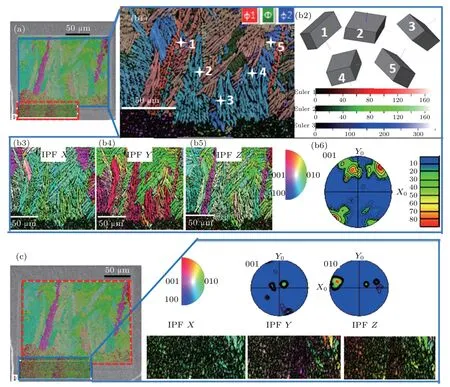
Fig.4. (a)The layered image of sample C.(b1)The orientation map of growth structure corresponding to the area marked by the blue line in panel(a). (b2)Wire frames of unit cell visualize the crystal orientations at the cross locations. (b3)-(b6)The individual IPF map and 001-pole figure reflect preferred orientation of the selected area in different directions. (c)Individual IPF image and pole figures corresponding to the layered image selected by the blue line.
4. Conclusion
The addition of nanonucleating agents ZrO2into CAMSbased diopside glass-ceramics contributes to lowering the crystallization temperature and reducing the activation energy,while the activation energy is increased after adding CeO2agents. Two discernible layers are detected inside the CAMSbased glass ceramics because of the mechanism of surface crystallization in diopside glass ceramics. The orientation of diopside grains around the interface can be identified as[001]and[010],and c-axes of diopside grains without CeO2 agents(samples A and B)are primarily perpendicular to the interface,while the c-axes of diopside grains with CeO2agents(sample C)are proved to be parallel to the interface. Nanocrystals are detected in the vicinity of the interface for sample C.
猜你喜歡
小天使·一年級語數(shù)英綜合(2022年4期)2022-04-28 22:02:07
中國民間療法(2021年7期)2021-07-22 06:43:38
雜文月刊(2019年19期)2019-12-04 07:48:34
校園英語·下旬(2017年5期)2017-06-13 19:07:41
Communications in Theoretical Physics(2017年6期)2017-05-12 08:53:09
試題與研究·教學論壇(2017年6期)2017-02-28 05:41:10
校園英語·中旬(2016年12期)2017-01-19 16:06:42
中國三峽(2016年5期)2017-01-15 13:58:43
歌海(2016年1期)2016-03-28 10:08:55
現(xiàn)代企業(yè)文化(2015年1期)2015-02-28 18:58:45
- Chinese Physics B的其它文章
- Topological magnon insulator with Dzyaloshinskii-Moriya interaction under the irradiation of light?
- Wavelength dependence of intrinsic detection efficiency of NbN superconducting nanowire single-photon detector?
- Artificial solid electrolyte interphase based on polyacrylonitrile for homogenous and dendrite-free deposition of lithium metal?
- Modulation of magnetic and electrical properties of bilayer graphene quantum dots using rotational stacking faults?
- Thermal conductivity characterization of ultra-thin silicon film using the ultra-fast transient hot strip method?
- Thickness-dependent magnetic anisotropy in obliquely deposited Fe(001)/Pd thin film bilayers probed by VNA-FMR?