
Influence of plasma-induced reflected wave variations on microwave transmission characterization of supersonic plasma excited in shock tube
2022-05-05 01:49:26JingTIAN田徑PingMA馬平BoCHEN陳波HaoquanHU胡皓全BinZENG曾彬LutongLI李路同andPuTANG唐璞
Plasma Science and Technology 2022年4期
Jing TIAN (田徑), Ping MA (馬平), Bo CHEN (陳波), Haoquan HU (胡皓全),Bin ZENG (曾彬), Lutong LI (李路同) and Pu TANG (唐璞)
1 School of Electronic Science and Engineering,University of Electronic Science and Technology of China,Chengdu 611731, People's Republic of China
2 Hypervelocity Aerodynamics Institute, China Aerodynamics Research and Development Center,Mianyang 621000, People's Republic of China
Abstract In this work, the theoretical analysis and experiment results investigating the influence of plasma-induced reflected wave variations on microwave transmission characterization are presented.Firstly, an analytical transmission line model for transmission characterization of plasma in shock tube is derived and validated against full-wave simulation.Then,the theoretical analysis of transmission characterization based on a time-dependent reconstruction algorithm that takes into account the variations of reflected wave is presented and the influence of reflection variations under various states of plasma is also investigated.The unusual increase in the amplitude of transmitted wave is theoretically predicted and experimentally demonstrated as well.Finally, the experiment results are also presented to illustrate the effects of reflected wave variations in practical microwave transmission characterization of supersonic plasma excited in shock tube.
Keywords: plasma, microwave transmission, shock tube
1.Introduction
During the reentry of spacecraft, the high-temperature and high-pressure induced by shock wave in front ionizes the air and creates a plasma sheath that strongly interferes with the microwave communication signals and results in radio blackout [1-4].To solve the resultant loss of communication between spacecraft and ground, it is necessary to investigate the characteristic of electromagnetic (EM)wave propagating in plasma.Over the past few decades,shock tubes have been widely used for ground investigation of plasma sheath [5-7].To diagnose the electron density of plasma excited in shock tube, probe techniques [8-10] such as Langmuir probe, have been developed.As an intrusive approach, probes can easily introduce significant interference to the excited plasma.Hence,the non-intrusive characterization approaches utilizing low-energy microwave signals have also been proposed.For instance,in[11-13]continuous sinusoidal signal was utilized in reflectometers to characterize shock tube excited supersonic plasma.Compared with the reflectometers that use ultra-short-pulse signal to measure the electron density profile of confined plasma in nuclear fusion or tokamaks [14-17],these approaches can measure both electron density and electron neutral collision frequency (also known as collision frequency)of plasma simultaneously.In addition, the reflectometers based on frequency sweeping can also be used to investigate the electron density profile of confined plasma[18-21].However, they are not suitable for the diagnosis of supersonic plasma excited in shock tube due to their low sweeping speed.
Regarding the microwave transmission characterization techniques, interferometers based on the phase shift of transmitted wave have been applied to measure the electron density of plasma [8, 22].In addition, a dual-frequency microwave transmission approach has also been experimentally demonstrated to achieve the electron density(or collision frequency)from the amplitude attenuation of transmitted wave [23].However, the corresponding collision frequency(or electron density)has to be estimated based on the experiment setup.Although another microwave transmission approach utilizing both amplitude and phase information of transmitted wave can simultaneously extract the electron density and collision frequency of plasma excited in shock tube [24], the amplitude variation and phase shift of transmitted wave are thought to be caused by the attenuation and effective propagation distance variations induced by plasma,respectively.Since the reflected wave energy also varies during the experiment,neglecting its effects on the amplitude variation and phase shift of transmitted wave may cause significant over- or under-estimations in the diagnosis of electron density and collision frequency.
2.Transmission line model analysis
Therefore, in this work the influence of reflected wave variations on conventional microwave transmission characterization of shock tube excited plasma is investigated.The transmission line model of EM wave propagating through plasma excited in shock tube is constructed and validated against full-wave simulation.This is followed by the theoretical analysis and validation of a microwave transmission characterization approach, which takes into account the reflected wave variations induced by the supersonic plasma in shock tube.The effects of reflected wave variations on the retrieval of electron density and collision frequency are then investigated.At last, a shock tube experiment is also carried out to illustrate the proposed influence in practice.
To investigate the influence of plasma-induced reflected wave variations on conventional microwave transmission characterization of shock tube excited plasma, a simple analytical model of shock tube measurement is derived based on transmission line theory.The measurement stage of shock tube, as illustrated in figure 1(a), is made of Poly tetra fluoroethylene (PTFE)with relative permittivity of ?t.The PTFE tube exhibits a square cross-section with a wall thickness of dtand the inner distance between PTFE walls is dp.To simplify the mathematical derivation, the effects of multiple reflections are not considered in the proposed model.Therefore, as shown in figure 1(b), on interface I, according to the boundary condition of electric field, one has

where E1and E2are the electric fields in regions 1 and 2,respectively.Γ1and Γ2are the reflection coefficients on interfaces I and II respectively.Therefore, the corresponding transmission coefficient can be achieved from equation(1)as

Consequently, the following equation can also be achieved from the boundary condition of magnetic field
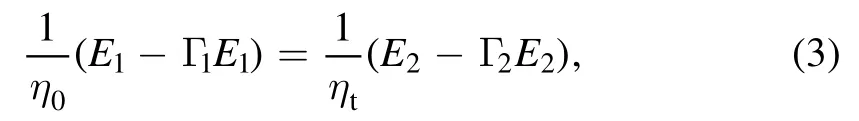
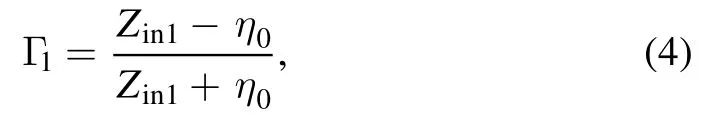
where η0≈377 Ω andare the characteristic impedances of air and PTFE wall respectively while μ0and ?0are the permeability and permittivity of air, respectively.By dividing both sides of equation (1)with (1+Γ1)and substituting the resultant expression of E1into equation (3), the expression of Γ1can be derived as
where

Similarly, on interface II the boundary conditions of electric and magnetic fields can be written as

where E3is the electric fields in region 3 andis the propagation constant in PTFE.ηpand kpare the characteristic impedance and complex propagation constant of plasma in the shock tube:

where ω is the angular frequency of interest and ?pis the equivalent complex permittivity of plasma that can be calculated as

where v is the angular collision frequency between electrons and ions while

is the plasma frequency, q is the elementary charge, neis the electron density and meis the electron mass.Hence, the reflection and transmission coefficients on interface II can be achieved in a similar manner as

where

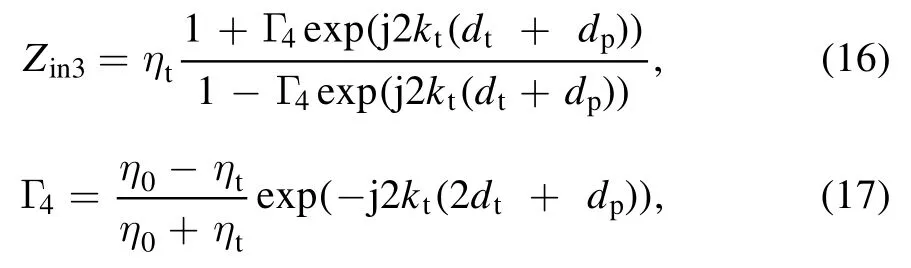
Next, by applying the boundary conditions of electric and magnetic fields on interfaces III and IV (i.e.Γ3and Γ4), the corresponding reflection and transmission coefficients are derived as

where
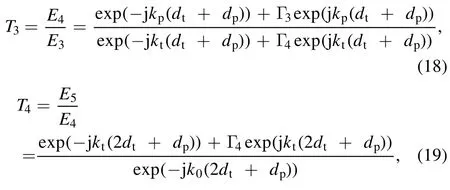
E4and E5are the electric fields in regions 4 and 5, respectively.Hence, the transmission coefficient of the overall shock tube is

As ?p=1 when the shock tube is filled with air, with the excitation of plasma both reflection(i.e.Γ1)and transmission(i.e.T)coefficients vary with the variation of ?p.
To validate the proposed transmission line model, the results carried out with finite element modeling (FEM)based full-wave simulation are compared with the reflection and transmission coefficients achieved from equations (4)and(20).The equivalent relative permittivity of plasma, calculated with equation (10), is used in the simulations.Edge effects are ignored by utilizing periodic boundary conditions in all directions to model the wave incident on an infinite plane.The actual shock tube dimensions with dt=3.5 cm,dp=8 cm and the complex permittivity of PTFE ?t=2.34 -0.01j are also used.In practical experiments, ne=5×1012cm?3and v=5×10¹¹rad s?1are the typical electron density and collision frequency of plasma excited in shock tube, respectively [25,26].Therefore, in figures 2(a)and(b),the amplitude and phase of transmission coefficient as functions of v are illustrated under a fixed neof 5×1012cm?3.In addition, the amplitude and phase of transmission coefficient as functions of neunder a fixed v of 5×10¹¹rad s?1are also depicted in figures 2(c)and(d).As can be seen from figure 2,excellent agreement has been achieved between the calculation and simulation results.Hence,the accuracy of analytical expressions derived for transmission and reflection coefficients in this work is validated.
3.Theoretical analysis
Generally, in conventional microwave transmission characterizations the electron density and collision frequency of plasma are retrieved with the measured attenuation and phase shift of transmitted wave.The amplitude variation and phase shift of transmitted wave are thought to be caused by the plasma-induced attenuation and variation of effective path length, respectively.However, as shown in figure 2, the reflection coefficient can exhibit significant variation with the state variation of plasma in shock tube as well.Hence,the plasma-induced reflection variations can potentially cause significant influence on the amplitude and phase of transmitted wave too.As a result, when the plasma-induced reflection variations are ignored, the extraction of electron density and collision frequency of plasma based on the conventional theory may exhibit significant errors.In order to investigate the influence of reflection variations on microwave transmission characterization of plasma, a theoretical analysis based on the transmission line model presented above is demonstrated.
In conventional microwave transmission characterization, plasma is considered as a homogeneous medium filled the whole shock tube with complex refractive indexCorrespondingly, the propagation constant of plasma can be written as γ=jk=α+jβ,where k is the wave number,If the plasma-induced reflected wave variations are ignored, the amplitude and phase variation of transmitted wave caused by the presence of plasma can be described with the following equations [24]

Hence,p′?andp″?can be calculated by solving equations(21)and (22)simultaneously once the attenuation and phase shift are known.Then, neand v are retrieved as

This conventional approach is simple and reasonable if the amplitude and/or phase variations of reflected wave are small during the experiment.However, as shown in figures 2(a)and (b), when the collision frequency of plasma in shock tube exhibits an increase from 109to 1012rad s?1,the reflection coefficient also exhibits over 7.5 dB and 50°amplitude and phase variations, respectively.Therefore, it is necessary to investigate the influence induced by the variations of reflected wave during the calculation of neand v.In order to make a comparison with the conventional method,a new microwave transmission characterization approach taking into account the effects of reflection variations is also proposed in this section.To retrievep′?and?p″of shock tube excited plasma considering both the variations of transmission and reflection coefficients, the transmission line model proposed in the previous section that can accurately describe the transmission and reflection of plasma in shock tube is used instead of equations (21)and (22).As the transmission coefficient of this model is calculated taking into account the variation of reflected wave, it is reasonable to achieve more accurate neand v compared with the conventional approach.
Basically, there are many evolutionary algorithms such as genetic algorithm that can be used to retrieve neand v from the measured amplitude and phase variations of the transmitted wave.However, as illustrated in [11] the microwave reflection characterization of plasma with genetic algorithm suffers from the multiple solution problem as various (ne, v)combinations can result in similar amplitude and phase variations in the reflected wave.Therefore, a time-dependent reconstruction algorithm is proposed to retrieve neand v for microwave reflection characterization of plasma[12,13].The basic idea behind this approach is to assume that during a short time interval the variations of neand v are limited.Thus,the results searching region is narrowed and the number of effective solutions is reduced.When the time interval is small enough, this algorithm can achieve a unique (ne, v)for the given amplitude and phase variations of reflected wave.In this work, this time-dependent reconstruction algorithm is used with the transmission line model presented above to retrieve neand v of plasma excited in shock tube from the amplitude and phase variations of transmitted wave.
As we know, the plasma sheath is pushed by the shock wave through the measurement window during the experiment, resulting in a time-varying?p(t)=?′p(t)+ j?″p(t)inside the shock tube.Hence,the corresponding transmission coefficient can be written as a function of ?p(t)

where f=ω/2π is the signal frequency.By splitting the overall characterization time into small intervals with a small and uniform step of Δt,it is reasonable to assume ?p(t)exhibit a continuous and linear increase or decrease procedure within(tn?1, tn)[12], where Δt=tn?tn?1and n=1, 2, 3, 4···.Consequently, if?p(tn-1,an-1,bn-1)=?′r(n-1)+ j?″r(n-1)is the complex permittivity of plasma at tn?1, the following approximation can be used in determining the time-varying complex permittivity of shock tube excited plasma

where t ∈(tn?1, tn).Hence, the coefficients anand bncan be determined through minimizing the following objective function with the Simplex algorithm [12, 27]

The overall calculating procedure is described in detail in figure 3.
It is noted that the initial condition of (tn?1, tn)is achieved from the previous interval (i.e.(tn?2, tn?1)).Since the shock tube is filled with air before the presence of plasma,?p(t0,a0,b0)=1 is used as the initial condition of the first interval.The calculation is repeated with various Δt until the result converges with a small enough time step.Then,?p(tn?1, an?2, bn?2)calculated with equation (26)is used as the initial condition of interval(tn?1,tn)to determine an?1and bn?1.With the calculated (a0, a1, ···an), (b0, b1, ···bn)and(?p(t0, a0, b0), ?p(t1, a1, b1), ···?p(tn, an, bn)), the equivalent complex permittivity of plasma (i.e.?p(t))at any t ∈(t0, tn)can be determined.
To investigate the influence of neglecting reflected wave variations and verify the validation of the proposed approach,a theoretical analysis with procedure presented in figure 4,utilizing manually constructed time-varying electron density and collision frequency combinations is presented.The timevarying ne(t)and v(t)are constructed with the following equation

where N=50 000 is the overall time points.The overall length of time to be analyzed is T=200 μs and the time step is B=T/N=0.004 μs.A is an integer that determines the maximum ne(t)or v(t).As can be seen in figures 5(a)and(b),the plots of ne(t)and v(t)are symmetrical about the line t=100 μs, indicating the exciting and recovering procedures of plasma follow a similar manner in the proposed theoretical analysis.The corresponding T(t)and ?p(t)for f=10 GHz are then calculated with equations (10)and (20)respectively, as shown in figures 5(c)-(f).It is well known that the microwave signal is attenuated while propagating through plasma.However, as shown in figure 5(d), |T| exhibits a small increment around t ≈15-30 μs, right before its falling edge.With the conventional theory [24], this gain of |T| cannot be explained as plasma only introduces attenuation to EM waves.However, when the variation of reflected signal is considered, it is possible to understand since the amplitude variation of transmitted wave is also affected by the variation of reflected wave.
To simplify the discussion, the results achieved with the conventional and the proposed microwave transmission characterization methods are marked as ‘without reflection’and ‘with reflection’ respectively in this paper.With the calculated phase and amplitude of transmission coefficient shown in figures 5(c)and (d), the complex permittivity with and without considering the reflection variations can be retrieved.As can be seen from figures 5(e)and (f), the real and imaginary parts retrieved with the proposed approach agree excellently with the original data while small deviations are observed in the complex permittivity extracted with the conventional approach.Figures 6(a)and (b)illustrate the electron density and collision frequency retrieved from the complex permittivity presented in figures 5(e)and(f).The plasma states between 25 μs and 175 μs are presented since both approaches do not perform well when ′? approaches 1.It is easy to see that both methods well reproduce the original electron density and collision frequency.However, as shown in figures 6(c)and (d)for f=7 GHz, the neand v retrieved with the conventional approach exhibit significant deviation compared with the original data between 60 μs and 140 μs.In addition, if f=7 GHz is used for the analysis while the originalmax( ne( t))≈ 5 ×1011cm?3andmax( v ( t))≈ 5×10¹¹rad s?1(another frequently observed state of plasma in shock tube experiment), as shown in figures 6(e)and (f), the conventional approach fails in retrieving the plasma states between 60 μs and 140 μs as the extracted real part of complex permittivity exceeds 1 when the effects of reflection variations are ignored.However, the approach taking reflection variations into consideration can still well reproduce the electron density and collision frequency.

Figure 1.(a)Schematic of transmission characterization of shock tube excited plasma; (b)the corresponding transmission line model.

Figure 2.Results achieved from full-wave simulation versus those calculated with transmission line model.(a)Amplitudes of transmission and reflection coefficients as functions of v under a fixed ne of 5×1012 cm?3;(b)phases of of transmission and reflection coefficients as functions of v under a fixed ne of 5×1012 cm?3;(c)amplitudes of transmission and reflection coefficients as functions of ne under a fixed v of 5×10¹¹ rad s?1; (d)phases of transmission and reflection coefficients as functions of ne under a fixed v of 5×10¹¹ rad s?1.
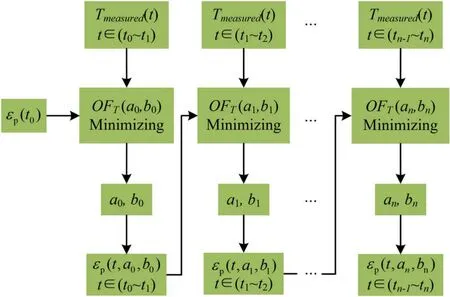
Figure 3.Retrieval procedure of equivalent permittivity of plasma.

Figure 4.Flow chart of the proposed theoretical analysis.

Figure 5.The theoretical analysis results as functions of time.(a)The plot of ne(t)constructed with equation (28)utilizing A=12.7 (i.e.max( n e( t))≈ 5 ×1012cm?3);(b)the plot of v(t)constructed with equation(28)utilizing A=11.7(i.e.max( v ( t))≈ 5 ×10¹¹rad s?1);(c)the calculated phases of transmission and reflection coefficients as functions of time; (d)the calculated amplitudes of transmission and reflection coefficients as functions of time;(e)the original,calculated and retrieved real part of complex permittivity of plasma as functions of time; (f)the original, calculated and retrieved imaginary part of complex permittivity of plasma as functions of time.

Figure 6.(a)Thecomparison betweenoriginal and retrievedelectron densityfor f=10 GHzwhilethe originalmax( n e( t))≈ 5×1012cm?3andmax(v( t))≈5 ×10¹¹rad s?1,respectively.(b)The comparison between original and retrieved collisionfrequency forf=10 GHzwhile the originalmax( n e( t))≈ 5 ×1012cm?3 andmax( v ( t))≈ 5 ×10¹¹rad s?1, respectively.(c)The comparison between original and retrieved electron density for f=7 GHz while the originalmax( n e( t)≈ 5 ×1012cm?3)andmax( v ( t))≈ 5 ×10¹¹rad s?1,respectively.(d)The comparison between original a nd retrieved collision frequency for f=7 GHz while the originalmax( n e( t))≈ 5 ×1012cm?3 and max( v ( t))≈ 5 ×10¹¹rad s?1, respectively.(e)The comparison between original and retrieved electron density for f=7 GHz while the originalmax( n e( t)≈ 5 ×1011cm?3)andmax( v ( t))≈ 5 ×10¹¹rad s?1, respectively.(f)The comparison between original and retrieved collision frequency for f=7 GHz while the originalmax( n e( t))≈ 5 ×1011cm?3 andmax( v ( t))≈ 5 ×10¹¹rad s?1, respectively.

Figure 7.(a)The ratio between retrieved and originalmax ( n e( t))for f=4 to 16 GHz while the originalmax( n e( t))≈ 5 ×1012cm?3 and max( v ( t))≈ 5 ×10¹¹rad s?1, respectively.(b)The ratio between retrieved and originalmax( v ( t))for f=4 to 16 GHz while the original max( n e( t))≈ 5 ×1012cm?3 andmax( v ( t))≈ 5 ×10¹¹rad s?1, respectively.(c)The ratio between retrieved and originalmax ( n e( t))for f=4 to 16 GHz while the originalmax( n e( t))≈ 5 ×1011cm?3 andmax( v ( t))≈ 5 ×10¹¹rad s?1, respectively.(d)The ratio between retrieved and originalmax( v ( t))for f=4 to 16 GHz while the originalmax( n e( t))≈ 5 ×1011cm?3 andmax( v ( t))≈ 5 ×10¹¹rad s?1,respectively.

Figure 8.Measurement setup of microwave transmission characterization of plasma excited in shock tube.

Figure 10.Analysis results as functions of time with f=7 GHz.(a)Phase of transmission coefficient; (b)amplitude of transmission coefficient; (c)retrieved real part of complex permittivity of plasma; (d)retrieved imaginary part of complex permittivity of plasma; (e)retrieved electron density of plasma; (f)retrieved collision frequency of plasma.
To further investigate the effects of plasma-induced reflection variations,the ratios between retrieved and original peaks of ne(t)and v(t)for both approaches at various characterization frequencies are presented.It can be seen in figures 7(a)and (b)(i.e.max( ne( t))≈ 5 ×1012cm?3and max(v(t))≈ 5 ×10¹¹rad s?1),both ratios achieved with the proposed approach are 1 while the ratios achieved with the conventional approach are close to 1 except at two narrow frequency bands centered around 4.5 GHz and 7 GHz.These deviations are caused by ignoring the reflection variations and negative ratio observed around 4.5-4.7 GHz is achieved because the real part of retrieved complex permittivity exceeds 1.In figures 7(c)and(d)(i.e.max(ne(t))≈ 5 ×1011cm?3andmax(v(t))≈ 5 ×10¹¹rad s?1), the conventional approach demonstrates much worse performance compared with last scenario.Therefore,in practice it is important to take into account the effects of reflection variations on microwave transmission characterization of shock tube excited plasma.Fortunately, by utilizing the transmission line model and time-dependent retrieval algorithm, the proposed approach is turned out to be stable and accurate regardless of the characterization frequency and states of plasma.
4.Experiment results and discussions
In the previous section,the theoretical analysis with manually constructed plasma states (i.e.ne(t)and v(t))have been used to illustrate the influence of reflection variations on microwave transmission characterization.As the actual states of plasma excited in shock tube are not used for the investigation, it is hard to estimate these effects in practical experiments.Therefore, in this section a microwave transmission characterization utilizing a four-stage shock tube is carried out to illustrate these influences in realistic.
As shown in figure 8, the rightmost stage of shock tube is filled with high pressure mixed gas (i.e.O2, N2and H2).The other stages are isolated with it utilizing an aluminium diaphragm and vacuumed to low pressure to model the return of spacecraft to earth atmosphere.When the mixed gas in the high-pressure stage is ignited,the diaphragm is broken and a shock wave is generated in the next stage that propagates to the left.Hence, the air in shock tube is ionized and forms a plasma sheath covering the wavefront.During the experiment,the velocity sensors are also placed on the second stage to measure the speed of shock wave while the third stage with PTFE instead of the metallic tube is used for microwave characterization.The dimensions of PTFE tube are identical to those used in the theoretical analysis.A pair of horn antennas are used for the transmitting and receiving of continuous sinusoidal signals with f=10 GHz and a pair of PTFE lenses are used to generate the required plane wave.In order to minimize the edge effects and eliminate the effects of environmental interference, an anechoic chamber is also utilized, in which the horn antennas and lens are placed.Finally,the amplitude and phase of time-varying transmitted wave before and after the presence of plasma are recorded during the experiment, which are then used to extract neand v.
Since the system records the phase and amplitude of the transmitted wave rather than transmission coefficients, the following equation has to be used to calculate the required time-varying transmission coefficient
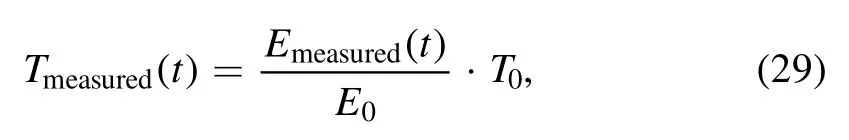
where Emeasured(t)is the measured electric field of transmitted wave while E0and T0are the measured electric field of transmitted wave and corresponding transmission coefficient respectively before the presence of plasma (i.e.the T calculated with equation (20)when ?p=1).Figures 9(a)and (b)illustrate the measured amplitude and phase of transmitted waves as functions of time.During the experiment, the lowpressure stages are vacuumed to 170 Pa and the speed of shock wave measured in the second stage is approximately 5 km s?1.As shown in the inset of figure 9(b), a small amplitude increment of transmitted wave is observed at the beginning.This phenomenon is in consistent with the theoretical prediction, indicating the increasing procedure of electron density and collision frequency of plasma during the experiment.Figures 9(c)and (d)depict the retrieved real and imaginary parts of equivalent complex permittivity of plasma as functions of time.As can be seen,?′ and ?″achieved with and without considering the reflected wave variations agree well with each other.
Hence, as shown in figures 9(e)and (f), the electron density and collision frequency extracted with both approaches exhibit small relative differences (Δd(t)s)of less than 30% and 40% over the plotted range.Here, Δd(t)is defined as

where G10GHz{with?reflection}(t)and G10GHz{without?reflection}(t)are ne(t)(or v(t))achieved with and without taking into account the effects of reflection variations at f=10 GHz,respectively.During t ≈0.625 to t ≈0.675μs, the relative differences of both neand v approach zero.This is in consistent with the theoretical analysis presented in figures 6(a)and(b)as the peak neand v approach their preset peak values(i.e.5 × 1018m?3and 5×10¹¹rad s?1)in this experiment.
However, if an inappropriate measurement frequency is selected for the conventional microwave transmission approach,the effects of ignoring the reflection variations may cause the failure of plasma characterization.For instance,when the measured electron density and collodion frequency presented as red lines of figures 9(e)and (f)are used as the original data of the theoretical analysis and a characterization frequency of f=7 GHz is used,significant deviations up to an order of magnitude can be observed between the results retrieved with and without considering the reflection variations, as shown in figure 10.Here, the relative difference Δd′ (t)in figures 10 (e)and (f)is defined as

where G7GHz(t)is the ne(t)(or v(t))achieved with(or without)taking into account the effects of reflection variations at f=7 GHz.As can be seen, whileΔd′(t)of the proposed method is almost 0 over the time duration of interest, the maximumΔd′(t)sof neand v achieved with the conventional method approach nearly 800% and 1000% respectively,resulting in significant errors in estimating the time-varying ne(t)and v(t)of plasma excited by shock tube.Furthermore,for the plasma states illustrated in figures 7(c)and (d), the number of inappropriate characterization frequencies for the conventional method is greatly increased and in practice it is hard to determine the appropriate characterization frequency in advance to avoid failure of characterization unless the states of plasma to be characterized can be well predicted.Last but not least, the dimension and wall thickness of shock tube can also affect the selection of appropriate characterization frequency.Therefore, instead of utilizing the conventional approach, it is always necessary to consider the effects of reflection variations on microwave transmission characterization of shock tube excited supersonic plasma.
5.Conclusions
The characterization of electron density and collision frequency of plasma with amplitude and phase information of transmitted wave has been of great interest over the past few decades.So far, the complex permittivity of plasma is calculated with the measured amplitude variation and phase shift of transmitted wave, neglecting the effects of reflected wave variations.Hence,in this work the influence of reflected wave variations on microwave transmission characterization of supersonic plasma excited in shock tube is investigated.A transmission line model is derived and validated against fullwave simulation.Then, the theoretical analysis including electron density and collision frequency retrieved with the time-dependent reconstruction algorithm is presented.The failure of the conventional microwave transmission characterization approach is also discussed and shock tube experiment is also carried out to demonstrate the influence of reflected wave variations in practice.
Acknowledgments
This work was supported by National Natural Science Foundation of China (Nos.62 001 095 and U20B2043), the Fundamental Research Funds for the Central Universities of China(No.ZYGX2018KYQD200),the National Science and Technology Major Project of the Ministry of Science and Technology of China (No.SQ2019YFA040012)and the National Defense Basic Scientific Research Program of China(No.2020-JCJQ-ZD-072).
ORCID iDs
猜你喜歡
課堂內(nèi)外·小學(xué)版(低年級(jí))(2023年6期)2023-04-29 00:44:03
小火炬·智漫悅讀(2023年8期)2023-04-15 20:14:20
小哥白尼(趣味科學(xué))(2022年7期)2022-09-20 06:07:36
紅蜻蜓·低年級(jí)(2022年8期)2022-08-04 01:17:30
浙江人大(2022年4期)2022-04-28 21:37:09
作文·小學(xué)低年級(jí)(2021年6期)2021-11-02 15:34:40
考試與評(píng)價(jià)·高二版(2020年6期)2020-09-10 07:22:44
中國體育教練員(2018年2期)2018-07-23 02:49:04
散文百家(2014年11期)2014-08-21 07:16:58
散文百家(2014年11期)2014-08-21 07:16:50
 Plasma Science and Technology2022年4期
- Plasma Science and Technology的其它文章
- Quantitative analysis and time-resolved characterization of simulated tokamak exhaust gas by laser-induced breakdown spectroscopy
- Quality enhancement and microbial reduction of mung bean (Vigna radiata)sprouts by non-thermal plasma pretreatment of seeds
- In situ quantification of NO synthesis in a warm air glow discharge by WMS-based Mid-IR QCL absorption spectroscopy
- Effects of the electric field at the edge of a substrate to deposit a ?100 mm uniform diamond film in a 2.45 GHz MPCVD system
- Realizing high efficiency and large-area sterilization by a rotating plasma jet device
- Study of post-arc residual plasma dissipation process of vacuum circuit breakers based on a 2D particle-in-cell model