
Raman scattering from highly-stressed anvil diamond*
2021-01-21 02:08:06ShanLiu劉珊QiqiTang唐琦琪BinbinWu吳彬彬FengZhang張峰JingyiLiu劉靜儀ChunmeiFan范春梅andLiLei雷力
Chinese Physics B 2021年1期
關(guān)鍵詞:張峰
Shan Liu(劉珊), Qiqi Tang(唐琦琪), Binbin Wu(吳彬彬),Feng Zhang(張峰), Jingyi Liu(劉靜儀), Chunmei Fan(范春梅), and Li Lei(雷力),2,?
1Institute of Atomic and Molecular Physics,Sichuan University,Chengdu 610065,China
2Key Laboratory of High Energy Density Physics and Technology(Ministry of Education),Sichuan University,Chengdu 610065,China
Keywords: diamond anvil cell,Raman scattering,pressure calibration,Brillouin zone
1. Introduction
Diamond has a cubic crystal structure with space group Fd-3m, in which two carbon atoms are arranged in the primitive unit cell (Fig. 1(a)). For a perfect crystal, the phonon modes in the proximity of the center of the Brillouin zone(BZ) can only be observed owing to the q ≈0 selection rule. Accordingly, the observed first-order Raman phonon at 1332 cm-1corresponds to the Γ point of BZ center in the diamond crystal with F2gsymmetry(Fig.1(b)). Under the uniaxial stress, the first-order Raman band of diamond exhibits asymmetry broadening and blue-shift, which is attributed to the strain effect that violates the translational invariance and breaks down the phonon wave vector selection rule.[1]

Fig. 1. (a) The crystal structure of cubic diamond, the black arrows indicate the Raman vibrational motions F2g. (b)The Brillouin zone of cubic diamond.
Due to the ultra-high bulk modulus (450 GPa)[2]and ultra-high hardness (Hv>110 GPa),[3]diamond single crystals with (100) crystal face are one of the best candidates for the anvil materials in the high-pressure experiments.[4]The high-frequency edge of the first-order Raman phonon in diamond reflects the stress state at the culet of anvil,and shows a monotonic pressure dependence of elastic strain. Therefore,the spectroscopic method based on the stress-induced diamond phonon is an effective pressure scale (>100 GPa) in a diamond anvil cell(DAC)experiment.[5]However,the pressuredependent shift of the high-frequency edge of diamond Raman is lack of detailed lattice dynamic analysis.
A new Raman band at ~600 cm-1was observed in both the highly-stressed(above 150 GPa)diamond anvil[6]and the nano-sized diamond particles sample.[7]Both the strain effect and size effect can be attributed to the disordered Raman band at ~600 cm-1in a phonon-confinement system. Typical examples of these systems include nano-sized crystals,[8,9]defect and impurity semiconductors,[10–12]highly-stressed[6]and structural-disordered materials.[13]By applying the relaxation of selection rule to all the phonon branches of BZ,many features like the redshift and the asymmetry broadening in the Raman spectrum of disordered carbon could be well explained.[13,14]Despite the progress achieved, the observed broad Raman band at ~600 cm-1under highly-stressed condition is still lack of detailed lattice dynamic analysis.
In this work, the Raman scattering from a pair of anvil diamonds in DAC has been studied at pressure up to 197 GPa.Up to the maximum pressure, one of the opposed diamond anvils occurs failure but cannot lead directly to the burst of anvils, and the other one remains intact that can be used for pressure calibration by the first-order Raman phonon. In order to gain a better understanding of phonon behavior in diamond under extreme conditions,we perform careful lattice dynamic analysis on the pressure-dependent Raman phonon of anvil diamonds by comparing the phonon dispersion curves of the diamond.
2. Experimental details
Raman scattering experiments were carried out on a custom-built confocal Raman spectrometry system in the backscattering geometry based on triple grating monochromator (Andor Shamrock SR-303i-B) with an attached EMCCD(Andor Newton DU970P-UVB); excitation was achieved by using a solid-state laser at 532 nm (RGB laser system) with laser power of 50 mW and collection by a 20×, 0.28 N.A.objective (Mitutoyo). The spectral resolution was within±1 cm-1,and the spatial resolution was within±1 μm.
High-pressure Raman experiments were conducted at room temperature using a DAC with 50 μm culet (Fig. 2(a))along the[100]diamond crystallographic direction(Fig.2(a)).The diamond anvils were compressed across the rhenium gasket to the maximum pressure (~197 GPa) until plastic deformation and micro-cracks occurred on the top of the upperanvil diamond. The culet surface of the upper-anvil diamond is no longer flat, exhibiting inhomogeneous light scattering, which is in sharp contrast with the lower-anvil diamond that was found still to be intact (Fig. 2(b)). The strain-induced cracks could not lead directly to the burst of anvils, but the cell pressure was found to suddenly drop to approximately 185 GPa. Upon slow decompression, numerous stepped cracks formed around the culets of the upper and lower anvils (Fig. 2(b)). When the pressure released to approximately 60 GPa,two intersecting longitudinal cracks were found in the upper-anvil diamond, with a consequent abrupt drop in the pressure value. This change indicates plastic deformation of the anvil tip,which has been documented for naturally deformed diamonds,[1]but not rarely identified in situ at high pressure.[6]
In the present study,the pressure was monitored through the high-frequency edge of the diamond phonon.[5]When the upper-anvil diamond occurs failure,the pressure calibration of DAC on decompression is only determined by the intact loweranvil diamond.Here,the compressive stress of the upper-anvil diamond is considered to be equal to that of the lower-anvil diamond.

Fig.2. (a)Schematic of the DAC geometry. (b)Selected microscope image of the lower-and upper-anvil diamonds on decompression. These images were acquired with the same light intensity.
3. Results and discussion
Spatially resolved micro-Raman spectra at the anvil tips provide direct information about the effect of normal stress on the diamonds. The first-order Raman phonon of diamond exhibits a sharp peak that corresponds to the triply degenerate optical phonons in the absence of stress. The uniaxial stress has been considered as the origin of the asymmetric broadening and blue-shift of the Raman phonon.[15–17]Under normal conditions, the first-order Raman phonon of anvil diamond shifts and splits under compression and decompression,meanwhile the second-order Raman phonons can also be clearly observed,as shown in Fig.3(a). The cell pressure can be routinely calibrated by the high-frequency edge of the first-order Raman phonon.
In a typical ultrahigh-pressure DAC experiment, one of the two opposite diamonds occurs early failure at the maximum pressure,unavoidably disabling the pressure calibration process. In the present experiment,the exhausted upper-anvil diamond occurs failure at the pressure of 197 GPa. Subsequently,the pressure within the cell exhibits a sudden drop to~185 GPa (the pressure was only determined by the loweranvil diamond). As a result, the first-order Raman peak becomes very week and the second-order Raman phonon cannot be observed(Fig.3(b)). At the same time,a strong broad peak centered at (ca.) ~600 cm-1appears in the low-frequency region (Fig. 3(b)). Thus, the pressure calibration of DAC can only be speculated from the intact lower-anvil diamond(Fig. 3(a)). However, the pressure of the upper and lower anvils will not be exactly the same,so the pressure of the upper diamond is an approximate value.
The intensity of the broad-band is directly correlated to the stress on the anvil. A new broad Raman band at 600 cm-1and the loss of intensity of the first-order Raman phonon in diamond were also observed by Mao et al. at sample pressures above 150 GPa.[6]Mao et al. considered that there was a close similarity between the new Raman feature and the one-phonon density of states of diamond (which has a broad peak centered at ~600 cm-1). They also considered that the new band may be associated with the appearance of fluorescence.[6]But the similar broad Raman band at 600 cm-1was observed in nano-sized diamond particles by Yoshikawa et al.[7]So the fluorescence mechanism was rule out. Both the strain effect and size effect can result in the low-frequency broad Raman band at ~600 cm-1, as a matter of fact, it can be explained by the disordered-activated Raman scattering from a phononconfinement system.
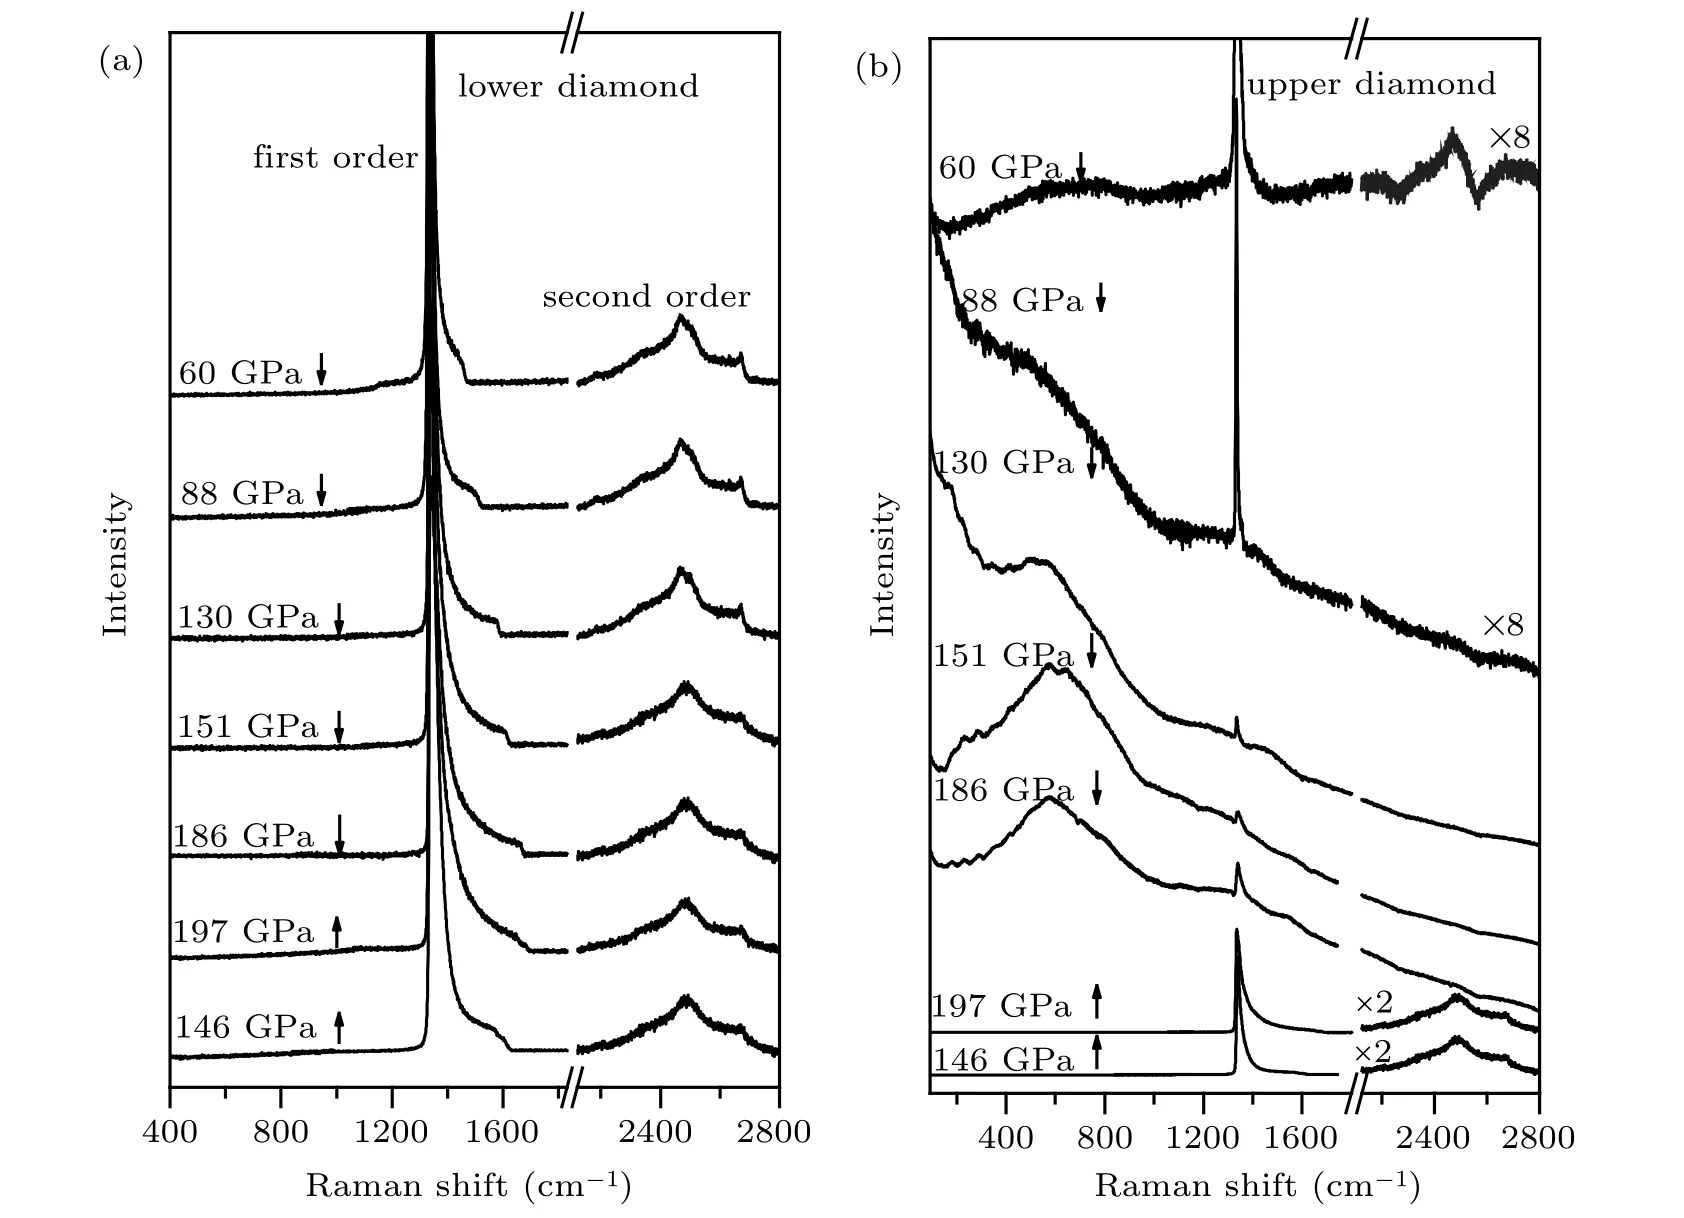
Fig.3. (a)Pressure dependent Raman spectra of the lower-anvil diamond. (b)Pressure dependent Raman spectra of the upper-anvil diamond.
Figure 4(a)shows the pressure-dependent Raman spectra of the upper-anvil diamond collected during decompression.As the pressure decreases,the low-frequency Raman band redshifts and becomes weaker in intensity (Fig. 4(b)), while the first-and second-order diamond Raman modes have gradually recovered (Figs. 3(b) and 4(a)). At pressure below 100 GPa,the low-frequency mode becomes very weak; and at pressure below 60 GPa, the low-frequency mode almost disappears,but the first- and second-order Raman modes are clearly observed(Fig.3(b)). It is shown that the low-frequency Raman broad band ca. 600 cm-1exhibits pressure dependence. The emergence of such a local phonon is attributed to the straininduced phonon confinements. The Raman selection rule is broken and the off-zone-center phonon modes are allowed.The disordered-activated Raman modes ca. 600 cm-1were also observed in the doped diamond.[6,7]By comparing the vibrational frequency, the observed local phonon is consistent with the low-frequency phonon density of states (PDOS) of the perfect diamond (Fig. 4(a)). The PDOS is defined as the contribution from a given atom to the total phonon, describing the number of states per an interval of energy at each energy level available to be occupied. The disordered-activated phonon modes in disordered materials can be expressed by the PDOS of a corresponding perfect structure. Such a correlation could imply a breakdown in crystalline selection rules,resulting perhaps from growth of defects(stacking faults)at the anvil tips associated with macroscopic flow of the diamond,or from the formation of a new high-density amorphous form of carbon.[6]
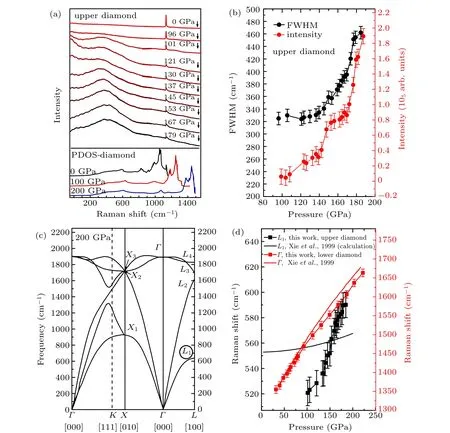
Fig. 4. (a) Pressure dependent Raman spectra of upper-anvil diamond on decompression. The black, red, and blue curves at the lower part represent the calculated PDOS[2]of diamond at 0 GPa,100 GPa,and 200 GPa,respectively.(b)The full width at half maxima(FWHM)(black)and relative intensity (red) of local phonon as a function of pressure. (c) Phonon dispersion curves of diamond at T =300 K, P=200 GPa in different directions,[2] both the edge point L1 and center point Γ are circled. (d) Comparison of experimental and calculated vibration frequencies for the edge point L1 and center point Γ.
The high-frequency edge of the first-order Raman phonon of the diamond, which is often used to the pressure calibration, corresponds to the BZ center Γ point (Fig. 4(c)), and the high-frequency phonon edge of the first-order diamond exhibits very similar pressure dependence with the Γ point(Fig.4(d)). The diamond Raman pressure gauge relies on the stability of crystal lattice of diamond under high stress.Plastic deformation induced by high stress leads to the inaccuracy and systematic deviation in the pressure calibration.By comparing with the calculated phonon dispersion curves of the diamond at 300 K,200 GPa,[2]the observed low-frequency broad Raman mode corresponds to the strain-induced zone-edge phonon of the L1transverse acoustic phonon branch(Fig.4(c)). Both the experimental and calculated values shift to lower energy with decreasing pressure(Fig.4(d)).It is also noted that the L1zone edge branch corresponds to the[100]direction of the diamond(Fig.1(b)),which corresponds to the experimental stress loading direction in the DAC(Fig.2(a)).
4. Conclusion
We studied the pressure-dependent disordered Raman phonon behaviors of anvil diamond to 197 GPa,and observed a broad Raman mode centered at 600 cm-1at the pressure above 100 GPa. The high-frequency edge of the first-order Raman phonon and the low-frequency broad Raman phonon were found to correspond to the zone center Γ point and the zone edge L1point, respectively. The diamond Raman pressure gauge relies on the stability of crystal lattice of diamond under high stress.
Acknowledgment
We thank Prof. Filippo Boi for helpful discussion.
猜你喜歡
南都周刊(2021年3期)2021-04-22 16:43:49
Chinese Physics B(2019年5期)2019-05-11 07:35:10
水動(dòng)力學(xué)研究與進(jìn)展 B輯(2018年1期)2018-04-13 12:23:21
歌劇(2017年7期)2017-09-08 13:09:37
故事會(huì)(2017年3期)2017-02-09 16:40:17
男生女生(金版)(2016年5期)2017-01-17 15:27:55
山西水利(2016年9期)2016-02-05 01:46:10
故事作文·高年級(jí)(2015年7期)2015-10-10 01:00:48
戀愛(ài)婚姻家庭(2015年3期)2015-09-10 07:22:44
Nuclear Science and Techniques(2014年4期)2014-03-07 12:24:27
- Chinese Physics B的其它文章
- Numerical simulation on ionic wind in circular channels*
- Interaction properties of solitons for a couple of nonlinear evolution equations
- Enhancement of multiatom non-classical correlations and quantum state transfer in atom–cavity–fiber system*
- Protein–protein docking with interface residue restraints*
- Effect of interaction between loop bases and ions on stability of G-quadruplex DNA*
- Retrieval of multiple scattering contrast from x-ray analyzer-based imaging*