
Development and validation of a rapid chromatographic method for the analysis of flunarizine and its main production impurities
2013-12-23 06:15:18NimhConnorMichelGeryMryWhrtonPulSweetmn
Nimh O'Connor, Michel Gery,*, Mry Whrton, Pul Sweetmn
aDepartment of Applied Science, Limerick Institute of Technology, Moylish Park, Ireland
bJanssen Pharmaceutical Limited, Little Island, Cork, Ireland
1. Introduction
Flunarizine, 1-[bis(4-fluorophenyl)methyl]-4-[(2E)-3-phenylprop-2-en-1-yl]piperazine(Fig.1),is a piperazine derivative produced by Janssen Pharmaceuticals Ltd. It is a mixed T and L type calcium channel blocker and sodium channel antagonist,so it can be used for the treatment of cardiovascular and neurological diseases, as well as in the prophylaxis and treatment of migraine headache.It is also an anticonvulsant and has been reported to reduce the duration of recurrent hemiplegia in children[1].It has a number of known impurities which are close in structure to the main compound.The current approved pharmacopoeia HPLC method for the determination of the main related substances is described in the European Pharmacopoeia [2]. Other methods for the HPLC analysis of flunarizine dihydrochloride in tablets have been detailed in the literature [3].
There are a number of methods described in the literature discussing the use of spectrophotometric techniques for flunarizine determination [4,5] as well as other chromatographic methods such as GC [6-8]. There are also a range of other papers describing the HPLC analysis of the compound in a number of matrices [9-12]. The current work presents a method that reduces the analysis time for flunarizine and its related impurities by almost 60%in comparison to the current approved European Pharmacopoeia method while still meeting the requirements for the validation parameters tested.Furthermore,laboratory stability studies indicate that the active pharmaceutical ingredient (API) and its impurities are stable in solution at ambient conditions upto 2 weeks after initial preparation.
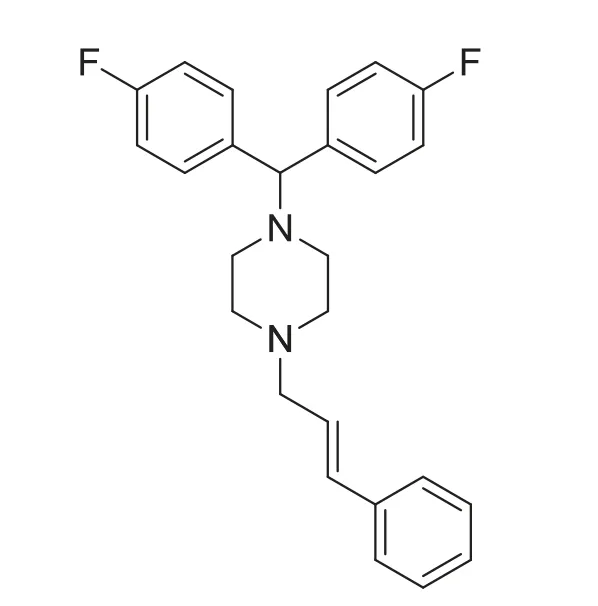
Fig.1 The structure of flunarizine.
2. Experimental
2.1. Materials and reagents
Samples of flunarizine dihydrochloride active pharmaceutical ingredient and the related impurities were supplied by Janssen Pharmaceutical Ltd., Cork, Ireland. HPLC-grade acetonitrile together with analytical grade ammonium acetate and tetrabutylammoniumhydrogen sulfate (TBAHS) [C16H35N·H2SO4],was purchased from VWR International (an Ireland supplier).Ultra-pure water was obtained using a Thermofisher TKA water purification system.
2.2. Instrumentation
The system used was an Agilent 1200 Rapid Resolution Liquid Chromatograph, with a 1200 Series binary pump SL and vacuum degasser, a 1200 Series high-performance autosampler, a 1200 Series thermostatted column compartment SL, a 1200 Series DAD SL for up to 80 Hz operation which was controlled by ChemStation B.02.01.SR1 data acquisition and evaluation software.The original analysis was carried out on a Thermo Scientific BDS C18 column (100 mm×4.6 mm i.d., 3 μm particle size). The column used for the new method was a Thermo Scientific Hypersil Gold C18 column(50 mm×4.6 mm i.d., 1.9 μm particle size).
2.3. Standard solutions and chromatographic conditions
Test solution for tests on original column was prepared by adding 2 mg of the API and each of the impurities to a 25 mL volumetric flask and diluting to volume with the mobile phase.
Solution for elution order was prepared by adding 2 mg of the API (on its own) to a 25 mL volumetric flask and diluting to volume with the mobile phase. This was repeated for all impurities A-D.
Linearity solutions for validation of the new method: A stock solution of 80 mg/L was prepared by weighing 2 mg each of the API and impurities A-D and adding them to a 25 mL volumetric flask. These standards were diluted appropriately for the linearity studies.
The conditions for the original method were as follows:The Thermo Scientific BDS C18 column (3 μm, 100 mm×4.6 mm i.d.)was installed in the thermostatted oven compartment and conditioned before switching to the mobile phase to equilibrate for 10 min or until a stable baseline was achieved.The mobile phase consisted of (A) a buffered solution prepared by dissolving 23.8 g of TBAHS and 7 g of ammonium acetate in 1.0 L of ultra-pure water and (B) acetonitrile.A gradient elution program was used as follows: 0-12 min,20-60% B; 12-15 min, 60% B; 15-16 min, 60-20% B; and 16-20 min, 20% B.
The flow rate was 1.5 mL/min with the oven at ambient temperature; the injection volume was 10 μL with the UV detector wavelength set at 230 nm.
The conditions for the newly developed method were as follows: The Thermo Scientific Hypersil Gold C18 column(1.9 μm, 50 mm×4.6 mm i.d.) was installed in the thermostatted oven compartment and conditioned by passing acetronitrile through it for an hour.The solvent was then switched to the mobile phase to equilibrate for 10 min or until a stable baseline was achieved. The gradient for the new method was as follows: 0-5 min, 25-43% B; 5-5.5 min, 43% B; 5.5-6 min,43-25% B; and 6-8.5 min, 25% B.
The flow rate was 1.8 mL/min with the oven at ambient temperature; the injection volume was 5 μL with the UV detector wavelength set at 230 nm.
3. Results and discussion
Flunarizine HCl and its four main impurities were first analyzed with the original method [2], on the Hypersil BDS C18 3 μm column, where a run time of 20 min was employed and the last peak, impurity D, was eluted at approximately 8 min (Fig.2).
3.1. Method development
An extensive investigation into what was the most suitable sub 2 μm column available was conducted. The carbon load and pore size were examined and compared to the available columns.A Hypersil Gold 1.9 μm column was available and it had similar percentage carbon loads as well as the same USP classification.
With the newly developed gradient a resolution of 1.6 or greater for components was obtained and all peaks were eluted in approximately 4.3 min (Fig.3).
The original method had a column conditioning step,which helped prevent buffer precipitation. With regard to the new method and column, a thorough wash step should be incorporated into the end of any sequence where the column will not be used afterwards for any length of time. This is to clear any buffer present on the column after analysis and to prevent precipitation.
3.2. Method validation
3.2.1. Linearity
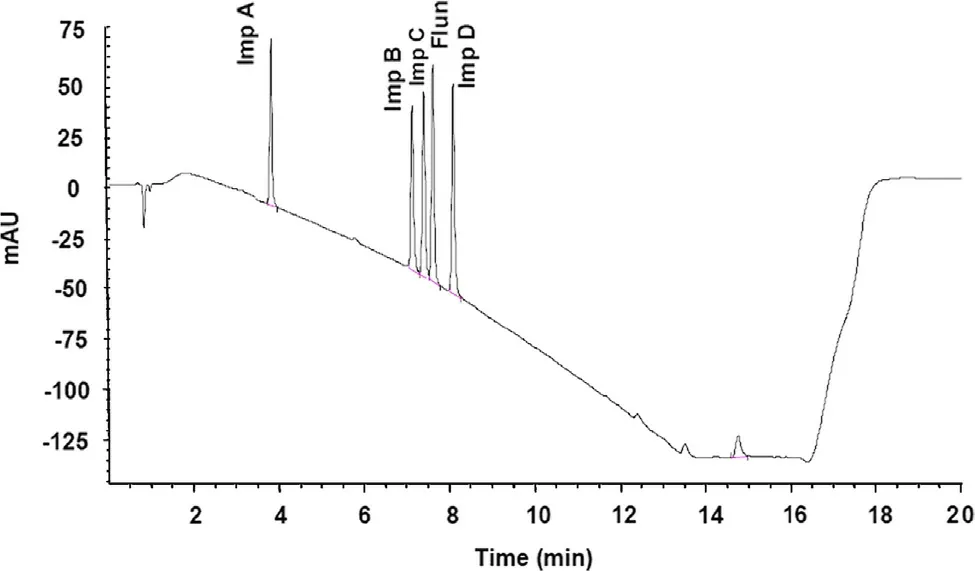
Fig.2 Separation of flunarizine and its four main impurities on the original column.
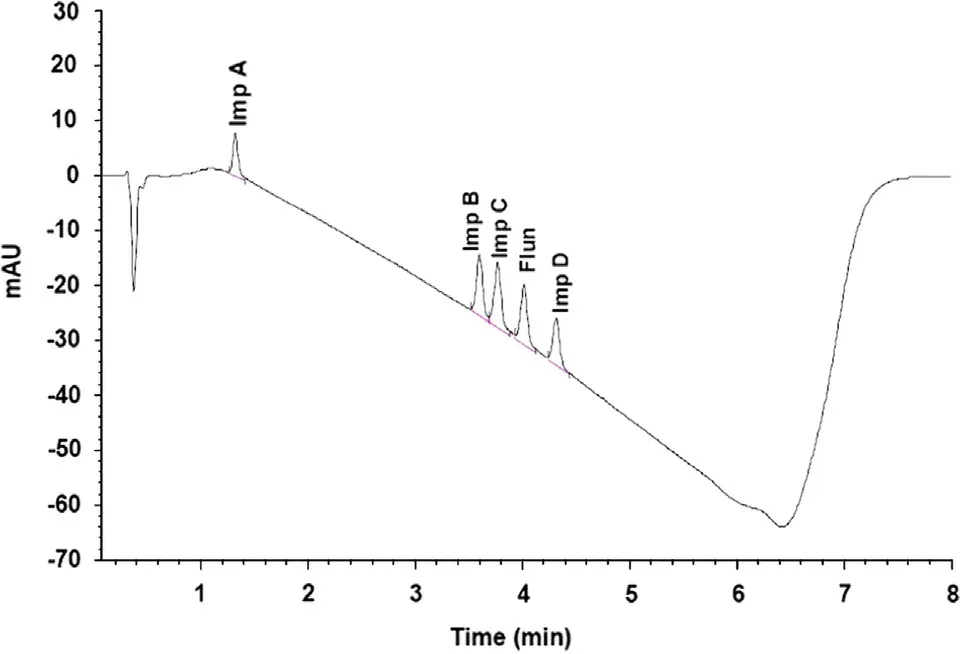
Fig.3 Separation of flunarizine and its four main impurities on Hypersil Gold 1.9 μm column.
The method was validated in accordance with the ICH guidelines. The linearity was examined over six concentrations, 10-40 μg/mL. The peak area for the individual replicated together with the mean and concentration values is shown in Table 1.Linear regression analysis was performed giving a regression equation of analysis was performed giving a regression equation of y=5.6625×-4.5608 and a correlation coefficient of 0.9994.The relative standard deviation was also calculated and found to be within specification at the percent values between 0.34%and 1.35%.
Calibration curves were also prepared for the four main impurities.Regression analysis was performed and correlation coefficient values ranged from 0.9992 to 0.9996. The percent relative standard deviation was calculated for impurities at each concentration (Table 2).
The linear relationship was shown with all the correlation coefficients over 0.99. The percent RSD values were also within acceptable limits of 1.5% for the API and the accepted limit of 10% for the impurities. The percent recovery was calculated for flunarizine and its four main impurities, the values were between 95% and 105% which was within the acceptable range for this method.
3.2.2. Precision
Precision was assessed with respect to analysis repeatability and injection repeatability in accordance with Janssens''specific requirements.
Analysis repeatability was performed by injecting six replicates of a 25 μg/mL and a 35 μg/mL solution of flunarizine and impurities.%RSD values were found to range from 0.67%to 1.21%for the 25 μg/mL sample and 0.47%to 0.84%for the 35 μg/mL sample (Table 3).
Injection repeatability was performed by injecting a solution of flunarizine and its impurities at two different concentrations (15 μg/mL and 30 μg/mL) for six times. % RSD values ranged from 0.27% to 0.76% for the 15 μg/mL sample and 0.30% to 0.45% for the 30 μg/mL sample (Table 3).

Table 1 Linearity data for flunarizine over the concentration range 15-40 μg/mL.
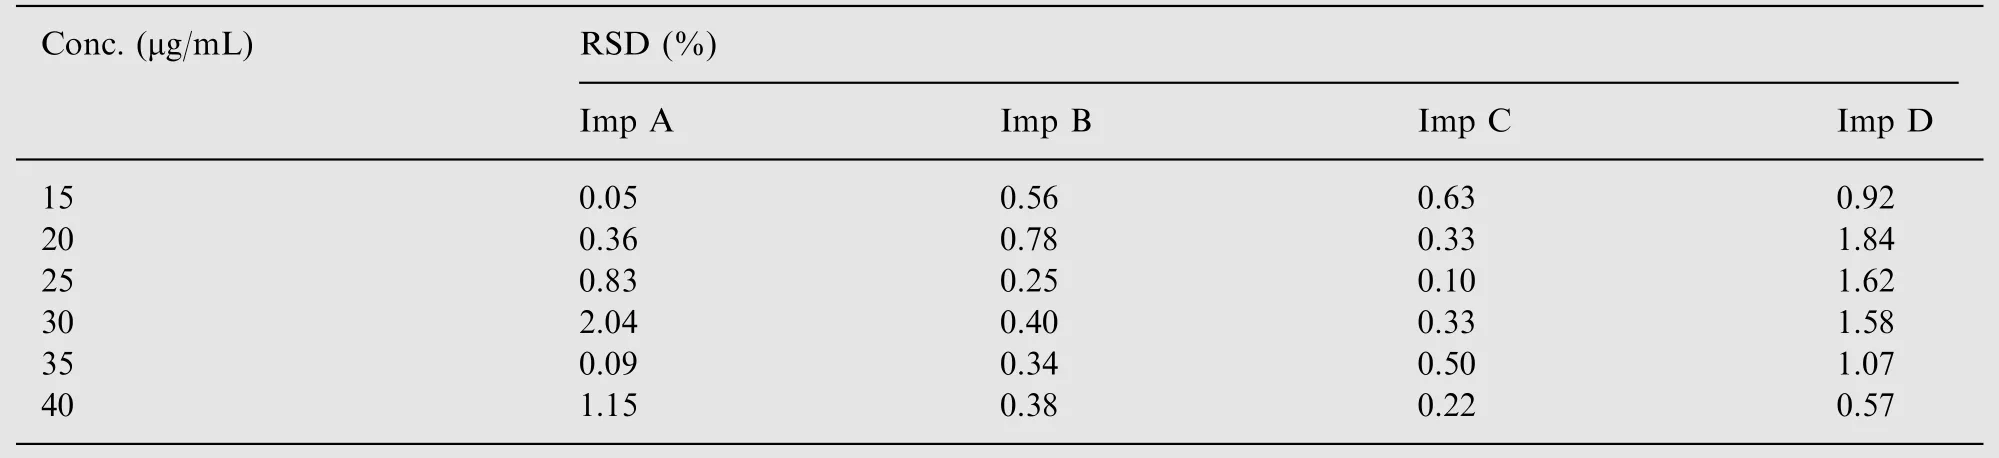
Table 2 The ranges of relative standard deviations seen for each impurity from linearity studies.
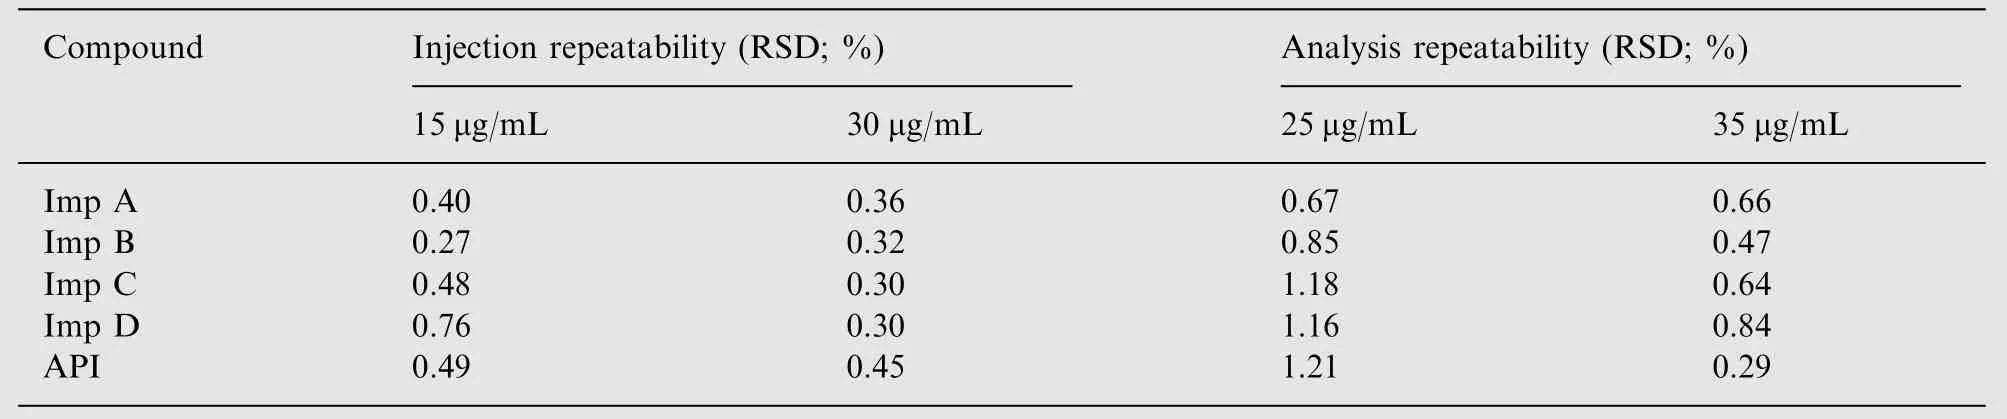
Table 3 RSD (%) data for precision studies for the API and its four impurities.
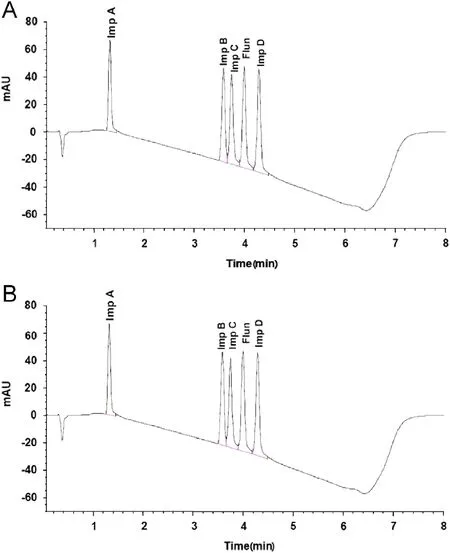
Fig.4 Sample stability chromatograms for naturally aged flunarizine and its impurities on day 0 (A) and day 14 (B) for samples stored in the clear vials under ambient conditions.
The results for both types of precision examined were well within the specified limits as all had%RSD values of less than 1.5%. Resolution data were obtained by injecting a solution containing 8 μg/mL of the API and its impurities (n=6) with the resolution between all peaks greater than 1.5.
3.2.3. Sample stability
Samples were stored in the clear and amber glassware at ambient temperatures in the fridge. Their stability was assessed at three intervals: immediately, after 1 week and 2 weeks, respectively. There was no notable degradation of any peaks at any of the testing intervals. This means that the samples can be kept and tested for upto 2 weeks without any degradation occurring. Data from the stability studies from naturally aged samples retained in the clear vials are shown in Fig.4.
[1] J.E.Belforte, C. Magarin?os-Azcone,I. Armando,et al., Pharmacological involvement of the calcium channel blocker flunarizine in dopamine transmission at the striatum, Parkinsonism Relat.Disord. 8 (1) (2001) 33-40.
[2] European Pharmacopoeia 6.0 vol. 1, European Directorate for the Quality of Medicines and Health Care, 2008, pp. 1911-1912.
[3] W.F. Kartinasari, H. Chufianty, G. Indrayanto, HPLC determination of flunarizine dihydrochloride in tablets and its validation,J. Liq. Chromatogr. Relat. Technol. 26 (7) (2003) 1059-1067.
[4] A.F.M. El. Walily, A. El. Gindy, A.A.M. Wahbi, Spectrophotometric determination of flunarizine dihydrochloride through the formation of charge-transfer complex with iodine,J.Pharmaceut.Biomed. Anal. 13 (1) (1995) 53-58.
[5] K. Kelani, L.I. Bebawy, L. Abdel-Fattah, Determination of astemizole, terfenadine, and flunarizine hydrochloride by ternary complex formation with eosin and lead(II), J. Pharmaceut.Biomed. Anal. 18 (6) (1999) 985-992.
[6] A. Yamaji, K. Kataoka, M. Oishi, et al., Simple method for determination of flunarizine in serum by gas chromatography, J.Chromatogr. 421 (1987) 372-376.
[7] R. Woestenborghs, L. Michielson, W. Lorreyne, et al., Sensitive gas chromatographic method for the determination of cinnarizine and flunarizine in biological samples, J. Chromatogr. B Biomed.Sci. Appl. 232 (1) (1982) 85-91.
[8] D.T. El-Sherbiny, M.I. Eid, D.R. EL-Wasseef, et al., Analysis of flunarizine in the presence of some of its degradation products using micellar liquid chromatography (MLC) or microemulsion liquid chromatography(MELC) —Application to dosage forms,J. Sep. Sci. 28 (2) (2005) 197-202.
[9] K. Busaranon, W. Suntornsuk, L. Suntornsuk, Comparison of UV spectrophotometric method and high performance liquid chromatography for the analysis of flunarizine and its application for the dissolution test, J. Pharmaceut. Biomed. Anal. 41 (2006)158-164.
[10] M.R. Fuh, C.J. Hsieh, Determination of flunarizine in rat brain by liquid chromatography-electrospray mass spectrometry,J. Chromatogr. B 736 (1-2) (1999) 167-173.
[11] M.R. Fuh, C.J. Hsieh, Y.L. Tai, Optimization for detection of flunarizine by liquid chromatography/electrospray/mass spectrometry, Talanta 49 (5) (1999) 1069-1075.
[12] Z.J. Lin, D. Musiano, A. Abbot, et al., In vitro plasma protein binding determination of flunarizine using equilibrium and liquid chromatography-tandem mass spectrometry, J. Pharmaceut.Biomed. Anal. 37 (4) (2005) 757-762.
 Journal of Pharmaceutical Analysis2013年3期
- Journal of Pharmaceutical Analysis的其它文章
- Development of a validated UPLC-qTOF-MS/MS method for determination of bioactive constituent from Glycyrrhiza glabra
- Determination of sildenafil by preconcentration on surfactant coated polymeric resin followed by spectrofluorimetry
- Volatile components of Rhizoma Alpiniae Officinarum using three different extraction methods combined with gas chromatography-mass spectrometry
- Thermally decarboxylated sodium bicarbonate: Interactions with water vapour, calorimetric study
- Determination and stress studies on YK-1101,a potential histone deacetylase, by HPLC-UV and HPLC-TOF/MS methods
- Accurate quantitation standards of glutathione via traceable sulfur measurement by inductively coupled plasma optical emission spectrometry and ion chromatography