
Record-breaking High-temperature Outlook for 2023: An Assessment Based on the China Global Merged Temperature (CMST) Dataset
2024-04-11 08:14:02ZichenLIQingxiangLIandTianyiCHEN
Advances in Atmospheric Sciences 2024年2期
Zichen LI,Qingxiang LI*,2,3,and Tianyi CHEN
1School of Atmospheric Sciences and Guangdong Province Key Laboratory for Climate Change and Natural Disasters,SUN Yat-Sen University; Zhuhai 519082, China
2Research Center for Ecology and Environment of Central Asia, Chinese Academy of Sciences; Urumqi 830011, China
3Southern Laboratory of Ocean Science and Engineering (Guangdong Zhuhai), Zhuhai 519082, China
ABSTRACT According to the latest version (version 2.0) of the China global Merged Surface Temperature (CMST2.0) dataset,the global mean surface temperature (GMST) in the first half of 2023 reached its third warmest value since the period of instrumental observation began,being only slightly lower than the values recorded in 2016 and 2020,and historically record-breaking GMST emerged from May to July 2023.Further analysis also indicates that if the surface temperature in the last five months of 2023 approaches the average level of the past five years,the annual average surface temperature anomaly in 2023 of approximately 1.26°C will break the previous highest surface temperature,which was recorded in 2016 of approximately 1.25°C (both values relative to the global pre-industrialization period,i.e.,the average value from 1850 to 1900).With El Ni?o triggering a record-breaking hottest July,record-breaking average annual temperatures will most likely become a reality in 2023.
Key words: CMST2.0,global mean surface temperature,record-breaking temperature,El Ni?o
1.Introduction
Global surface temperature (ST) change is an important indicator of changes in the climate system and one of the core elements of the successive reports of the Intergovernmental Panel on Climate Change (IPCC).Land surface air temperature(LSAT) is monitored by long-term meteorological observation stations,while sea surface temperature (SST) is primarily monitored by ships,satellite remote sensing,and buoys.Global ST is obtained by merging these two components.The IPCC’s Sixth Assessment Report (AR6) by Working Group I,released in August 2021,stated that each decade has been warmer than the previous one over the past 40 years,with an increase of 1.09°C in global mean surface temperature (GMST) in 2011-2020 relative to the pre-industrialization (represented by the 1850-1900 average).This conclusion is based on five global benchmark ST datasets currently widely recognized by international peers (HadCRUT5 in the UK;NOAAGlobalTInterim,GISTEMP v4 and Berkeley Earth in the United States;and CMST-Interim in China),and several of their derivatives(Gulev et al.,2021).
In July 2023,the World Meteorological Organization declared that El Ni?o conditions have developed in the tropical Pacific (https://public.wmo.int/en/media/press-release/world-meteorological-organization-declares-onset-of-el-ni%C3%B1 o-conditions).The high correlation between El Ni?o and changes in global ST has brought the former back to the attention of scientists and the public.There is a general concern about whether the shift of the tropical Pacific from the La Ni?a phase to the El Ni?o phase will bring about a new record-breaking event in global ST.Based on version 2.0 of the China global Merged Surface Temperature dataset (CMST2.0),we systematically assessed the GMST anomalies since the beginning of 2023,in combination with the variations in LSAT and SST.We present a brief review of the GMST anomalies in the first half of 2023,and give a preliminary outlook for the magnitude and ranking of 2023 among the hottest years in recorded history.
2.Data and methods
2.1.CMST2.0
Among the five benchmark datasets adopted in AR6,the CMST dataset,independently developed by a team from Sun Yat-sen University,is thus far the only one from China.Based on the global land surface air temperature (GLSAT) data from January 1850 to July 2023 and the integration of relevant new research results from several countries and regions over the past decade,this dataset has facilitated numerous research results through innovative reconstruction methods and parameters,as well as model uncertainty assessment (Yun et al.,2019;Sun et al.,2021,2022;Li et al.,2022a,2023;Xie et al.,2022).
AR6 used the CMST-Interim version,but since the polar ice ST has not yet been reconstructed in its SST component(ERSST.v5),AR6 considered that only the LSAT component,C-LSAT2.0,fulfilled the requirement of being a global benchmark LSAT dataset (Gulev et al.,2021).Thereafter,the team released the latest version of the dataset,CMST2.0 (Sun et al.,2022;Li et al.,2023),which includes three variants: CMST2.0-Nrec (no reconstruction),CMST2.0-Imax,and CMST2.0-Imin (based on the reconstructed sea-ice surface air temperature region in the Arctic).The reconstructed dataset has greatly increased data coverage,with the coverage of CMST2.0-Imax and CMST2.0-Imin in the Northern Hemisphere increasing by more than 90% since the 1950s,thus improving global,hemispheric,and regional long-term trends.Although CMST2.0 was not used by AR6,it is currently available at http://www.gwpu.net.
In this study,we used CMST2.0-Imax,which we refer to as CMST2.0.According to Li et al.(2023),although there are minor differences between CMST2.0-Imax and -Imin,the ST variations in the former are more consistent with other datasets used by AR6,especially after 1880,as described in Li et al.(2020a) (Fig.1),suggesting that CMST has high reliability.
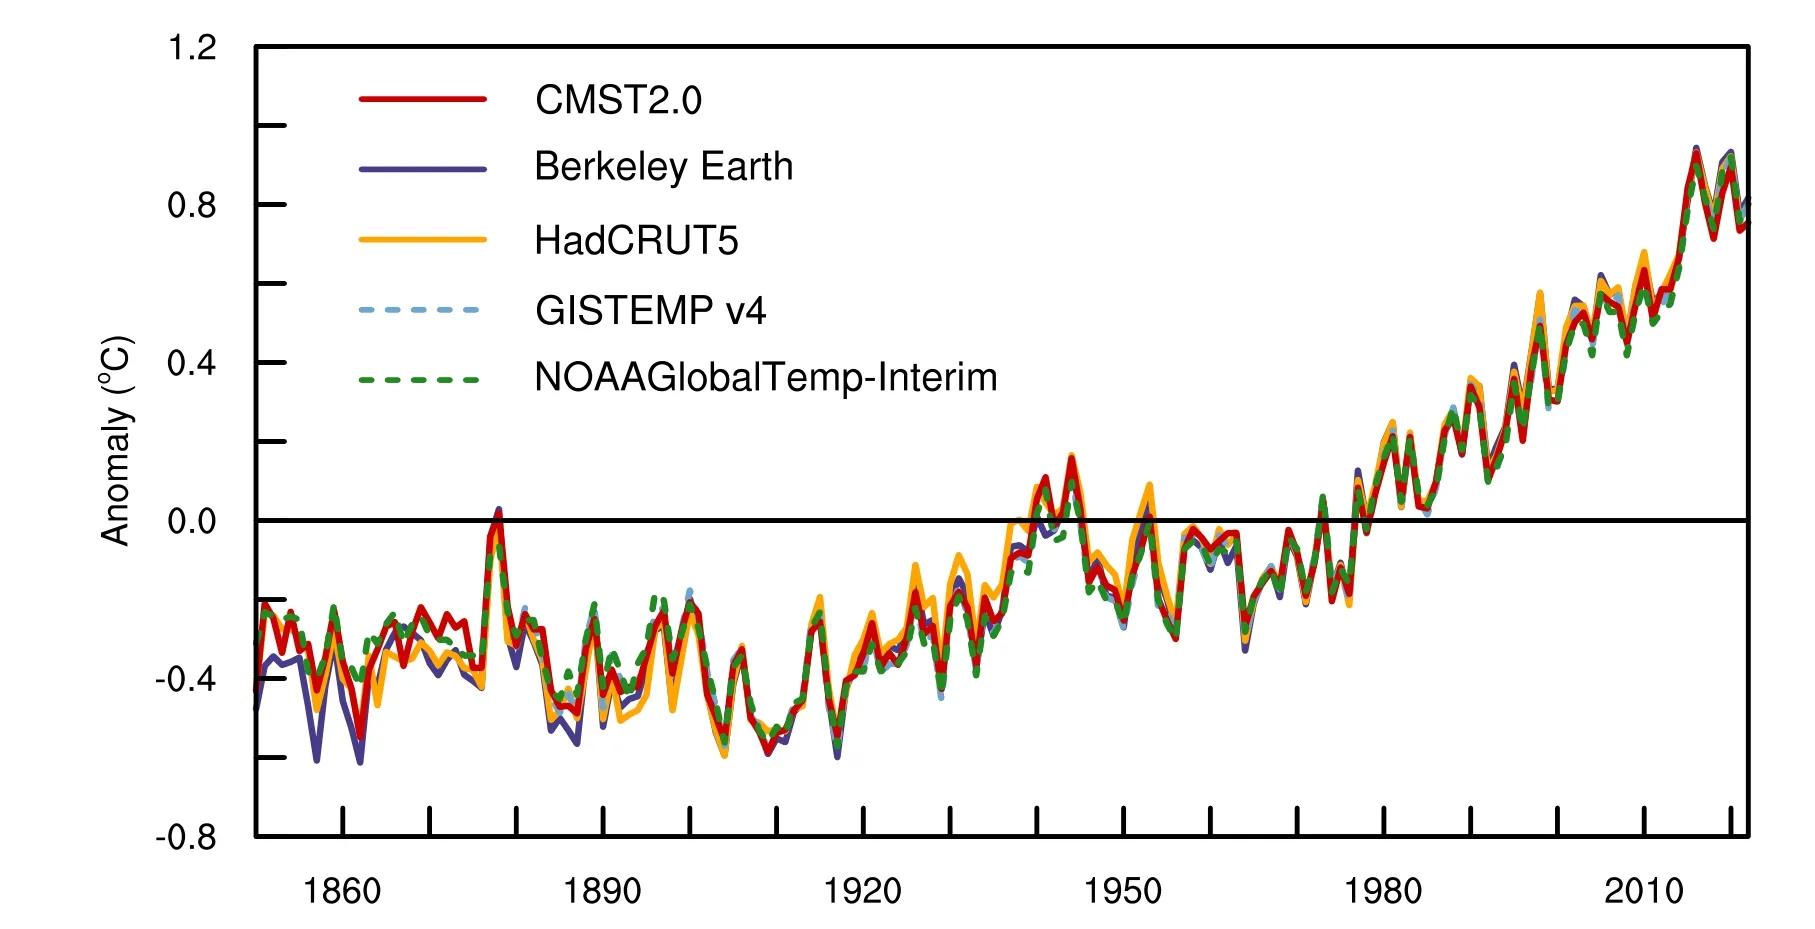
Fig.1.Comparison of GMST time series derived from several temperature datasets adopted in IPCC AR6 and CMST2.0 during 1850-2022.
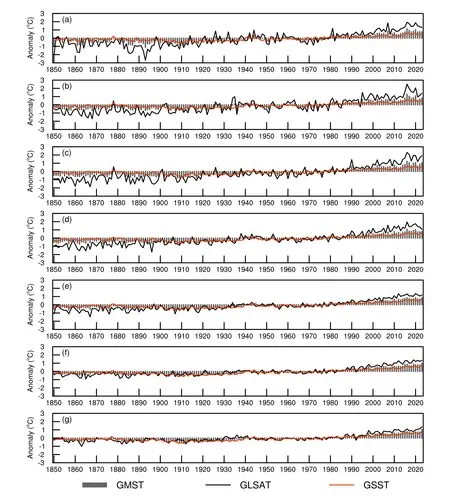
Fig.2.Mean temperature series from (a) January to (g) July during 1850-2023 based on CMST2.0 (gray bars represent the GMST;the black line and orange line represent the GLSAT and GSST,respectively).
2.2.Climate change indices
The climate change indices used in this study are the Ni?o-3.4 index,the Atlantic Multidecadal Oscillation (AMO)index,and the Pacific Decadal Oscillation (PDO) index,for the period January 1854 to July 2023,all calculated using ERSST.v5 (Rasmusson and Carpenter,1982;Enfield et al.,2001;Mantua and Hare,2002) and available at https://www.ncei.noaa.gov/pub/data/cmb/ersst/v5/index/ (accessed August 2023).
2.3.Calculation and ranking methods for the GMST series
All ST anomalies in this study are relative to the average of 1961-1990,unless otherwise specified.The calculation of GMST anomalies adopts the traditional climate anomaly method (Jones et al.,1986).The specific steps are as follows: (1)The STs at different latitudes are weighted by the cosine function of latitude to ensure that the large-scale temperature averages are computed according to the grid-area weights;(2) Due to the differences between LSAT and SST,they are first calculated separately,and then weighted and averaged in proportion to the sea-land surface area to yield the final GMST anomaly series.
Using a simple interpolation method,we supplemented the ST anomalies for the remaining five months of 2023 with the average ST for the same month in the last five years (2018-2022) to provide an outlook for the annual GMST in 2023.
3.First half average temperature review and annual outlook in 2023
3.1.Review of average ST in the first half of 2023
Figure 2 shows the variations of the GMST,GLSAT and global sea surface temperature (GSST) anomalies for January to July during 1850-2023,and Table 1 shows their anomaly values and ranks from January to July in 2023.As can be seen,while GLSAT only reached its second highest level on record in June,GSST hit record levels after April,so GMST continued to set new all-time high temperature records after May.
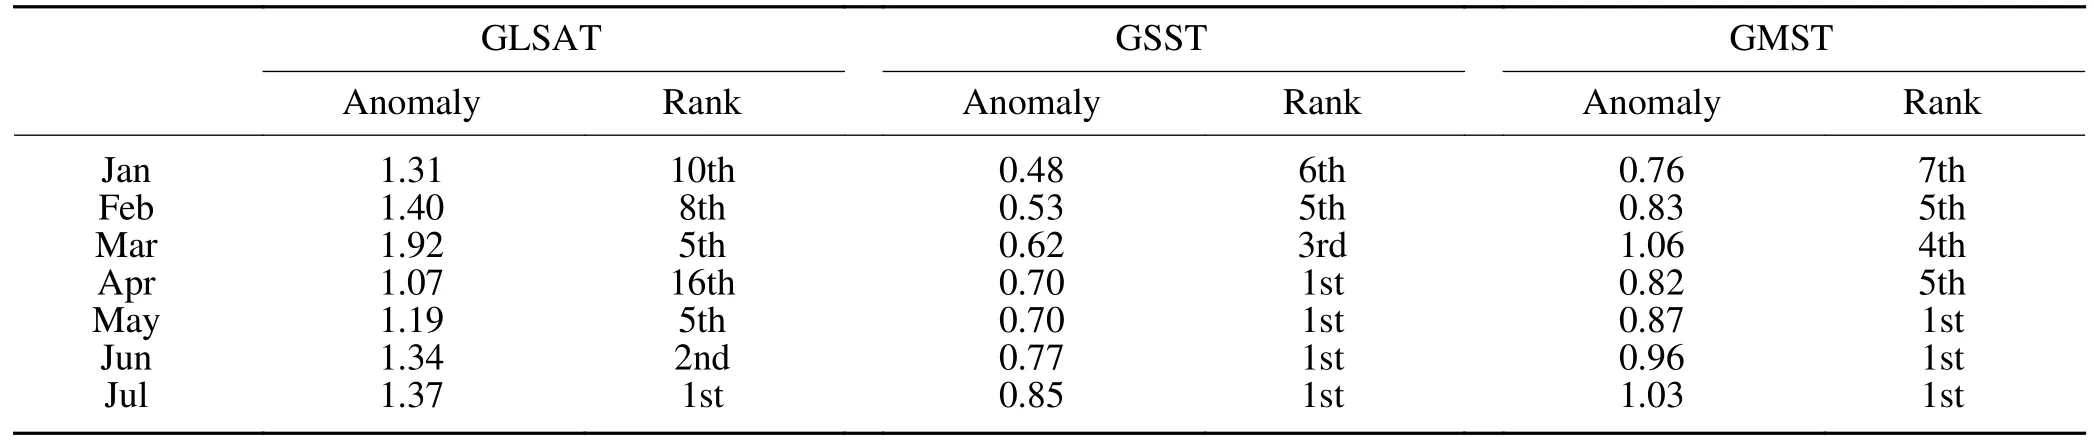
Table 1.Anomalies (relative to 1961-1990;°C) and ranks (out of 174 years) of GLSAT,GSST,and GMST from January to July 2023.
The characteristics of the evolution of ST anomalies during January-July 2023 can be further revealed on the basis of the results in Fig.3.In January,positive anomalies exceeding 4°C occurred in Europe,North America,and the Arctic,while negative anomalies dominated in northern East Asia (with a regional center below -4°C).The oceans are covered by positive anomalies except for the central-eastern Pacific Ocean and part of the Southern Ocean.In February,the region with anomalies above 4°C in the Northern Hemisphere shifted eastward and southward,with North America being predominantly cold,and the negative anomaly region over the oceans shrank considerably.In March,positive anomalies dominated in Asia and Europe,and the whole world was covered by positive anomalies except for the central part of North America and its adjacent oceans;an obvious signal of El Ni?o development was seen off the west coast of South America.Since April,the oceans have been almost completely covered by positive anomalies,and the El Ni?o pattern has continued to develop.The strongest positive anomalies over land in May were located in the northern part of the Asia-Europe border and the northern part of North America,while negative anomalies dominated over the Tibetan Plateau,South Asia,and Australia.Positive anomalies were observed worldwide in June,except for a few regions.
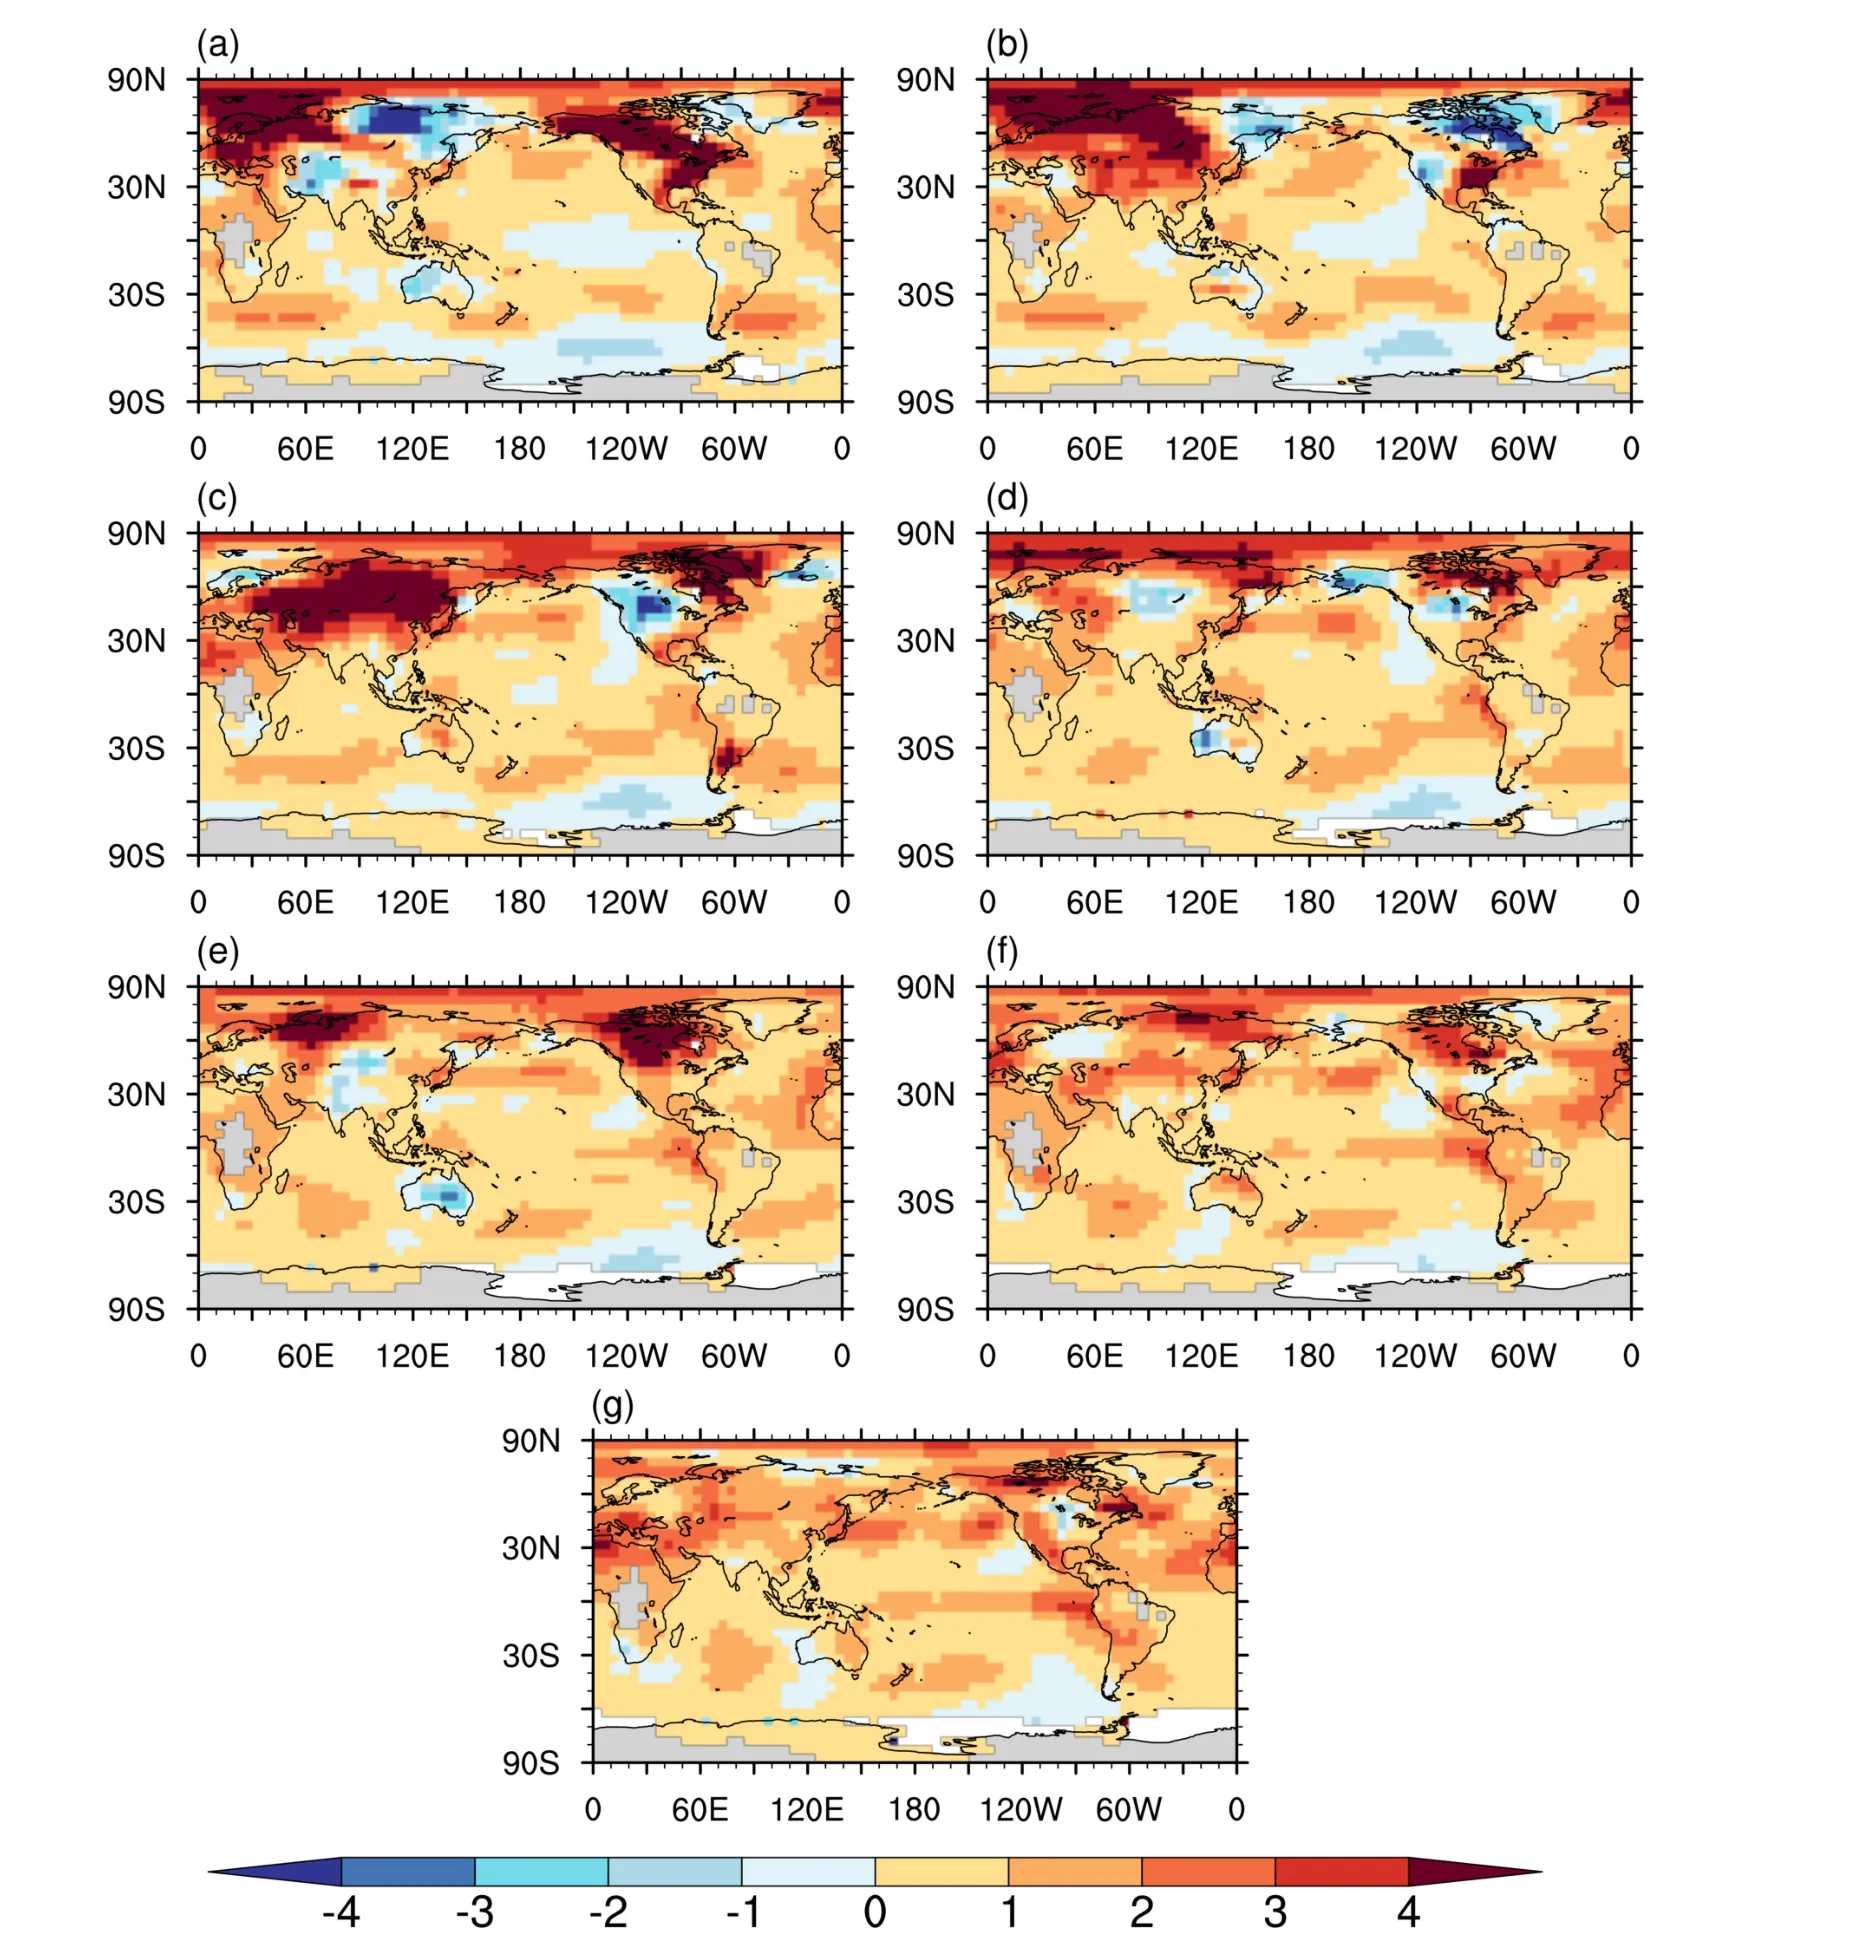
Fig.3.Evolution of global ST anomalies (°C) from (a) January to (g) July 2023 based on CMST2.0.
The computation of the mean ST anomaly series for the first half of the year is shown in Fig.4.The GMST for the first half of 2023 is the third highest temperature year since 1850 (0.88°C),lower only than the warmest years of 2016 (1.07°C)and 2020 (0.89°C).
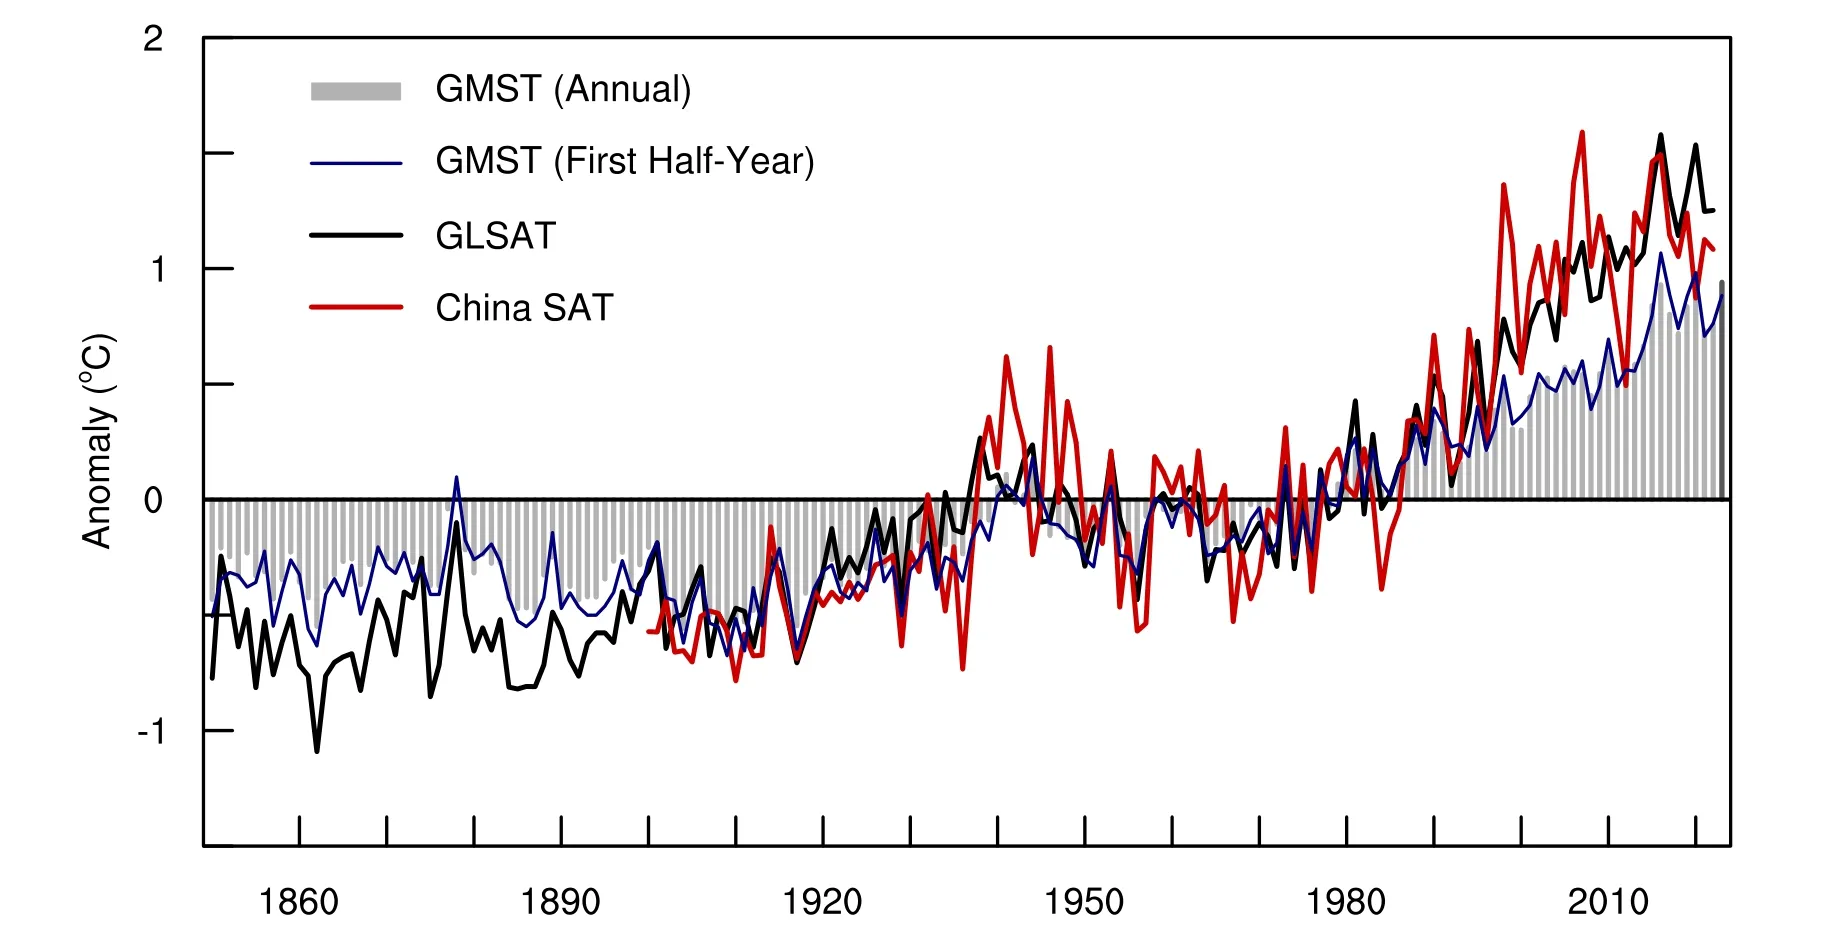
Fig.4.Comparison of annual GMST (gray bars;the predicted value for 2023 is shown as a dark gray bar),GMST in the first half of the year (blue line),GLSAT (black line),and regional temperatures in China (red line) from CMST2.0.
3.2.Outlook for GMST in 2023
Global ST continued to be warmer into the second half of the year,with Fig.3g (July) showing increasing LSAT anomalies in North Africa,southern Europe,and Canada,which may be related to the ongoing wildfires raging there (https://www.france24.com/en/africa/20230724-algerian-wildfires-kill-more-than-30-people-amid-blistering-heatwave;https://apnews.com/article/canada-wildfires-record-health-united-states-9afe003fba12d7c135adcc4d5308c5ac;https://edition.cnn.com/2023/07/26/world/wildfires-mediterranean-italy-greece-algeria-climate-intl/index.html).The El Ni?o phase has become more pronounced in terms of SST in the central and eastern Pacific.The North Pacific Ocean,the southern Indian Ocean,and the central and northern Atlantic Ocean are also showing a tendency to be anomalously warm.Both the GLSAT and GSST in July were the highest since the period of instrumental observations began,and the GMST anomaly reached a record high of 1.03°C as a result of the combined effect of the two components (Fig.3g).
On this basis,interpolating the ST for the remaining five months of 2023 with the averages for the same month in the latest five years (2018-2022),it was calculated that the GMST anomaly in 2023 (1.26°C of warming relative to the pre-industrialization period,i.e.,the average of 1850-1900) will be close to,or even break,the record high ST anomaly of 2016 (1.25°C)(Fig.4).This record-breaking situation is highly likely to become a reality,judging from the fact that the global ST in July has already clearly set a new record.
4.Summary and discussion
With the successive rapid warming of GLSAT and GSST anomalies,the GMST has reached record levels since May 2023,resulting in the third hottest first half year since the instrumental observation period began.Depending on the development of the El Ni?o phenomenon,it is predicted that the monthly SST anomalies will remain at record levels consecutively and the annual GMST of 2023 may exceed that of 2016 and 2020 to become the hottest since 1850.The warming relative to pre-industrialization could be close to 1.3°C if the GMST reaches the average level of the past 5 years (2018-2022) in the remaining months of this year.The above conclusions based on the evaluation from CMST show good agreement with those from other benchmark datasets (HadCRUT,Berkeley Earth,NOAAGlobalT and GISTEMP).
There are many factors contributing to anomalous global warming,with human activities (including emissions of greenhouse gases such as carbon dioxide,methane,etc.) dominating the long-term warming,especially on 50-to 100-year time scales (Hegerl et al.,1996;Stott and Tett,1998;Qian et al.,2021).On shorter time scales,variations in the internal fluctuations of the climate system,such as ENSO,PDO and AMO,have greater impacts on the interannual or interdecadal warming(Dai et al.,2015;Huang et al.,2020).El Ni?o events have been proved to be significantly associated with the occurrence of extremely high-temperature anomalies (Gergis and Fowler,2009;Zhai et al.,2016).The recent super-strong El Ni?o events of 1997-1998 and 2014-2016 produced record-high global ST in 1998 and 2016,respectively;the weaker El Ni?o events in 2009-2010 and 2018-2020 were also followed by the highest-and second-highest ST anomalies in 2010 and 2020,respectively (Figs.4 and 5).From this perspective,it is predictable that the development of El Ni?o (Fig.5a) will yield high GMST anomalies in 2023 and even for a possible future warmer global ST in 2024.In addition,the current Atlantic SST is in a very dominant AMO positive phase,which is also conducive to the convergence of global temperature to higher values(Fig.5c),providing a more stable correlation between it and global ST than that of the PDO (Fig.5b) (Chylek et al.,2016;Li et al.,2020b).
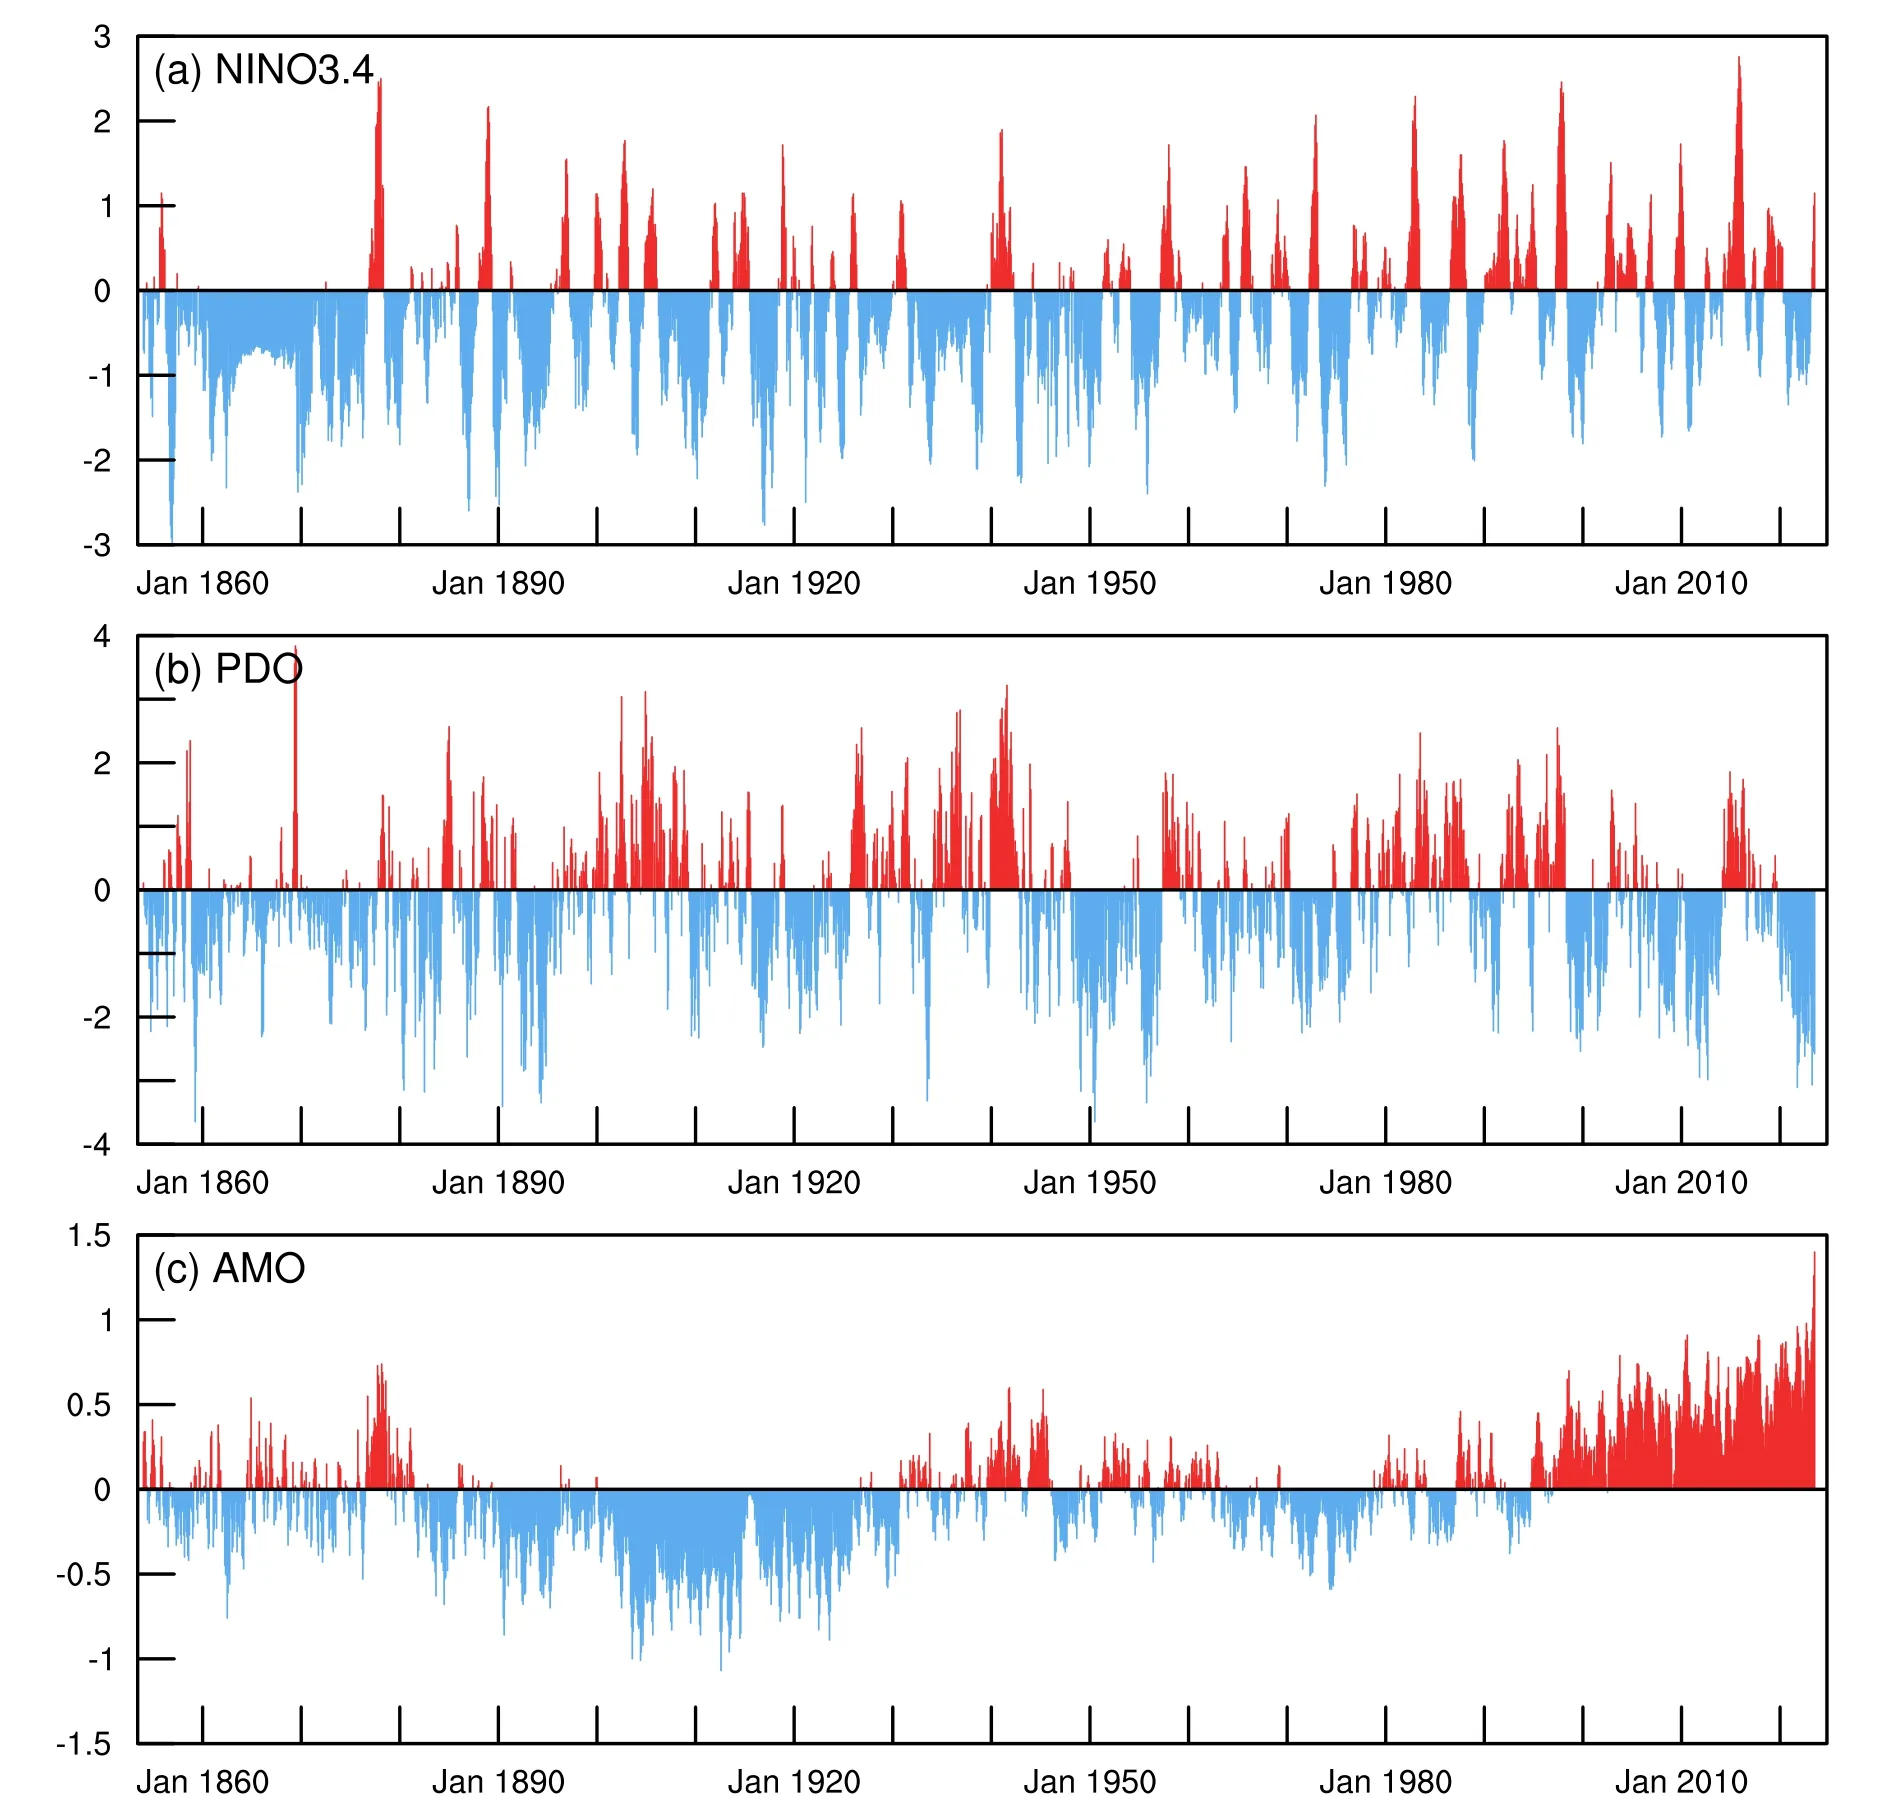
Fig.5.Monthly Ni?o-3.4,PDO and AMO index variations from January 1854 to July 2023.
Lastly,global warming has also brought far-reaching impacts to the corresponding climate change taking place at regional scales (Li et al.,2022b).On the one hand,the acceleration of global warming results in an increase in the probability of various extreme climate events and even disasters (Wen et al.,2013;Nangombe et al.,2018;Hu et al.,2020;Sheng et al.,2023).Although the regional temperature anomaly in China has not shown a significant increase in the last 25 years (Fig.4),frequent occurrences of extreme events have been seen across China in recent years (Li et al.,2015).On the other hand,the intensification of global warming will also have a significant impact on human comfort under the condition of accelerating temperature,and human discomfort will increase significantly,which will be more prominent in low latitudes than high latitudes (Li et al.,2017,2018;Huang et al.,2022) and deserves further attention.
Acknowledgements.The authors acknowledge support from the National Natural Science Foundation of China (Grant Nos.41975105 and 42375022).
 Advances in Atmospheric Sciences2024年2期
- Advances in Atmospheric Sciences的其它文章
- Impact of Sky Conditions on Net Ecosystem Productivity over a “Floating Blanket” Wetland in Southwest China
- Circulation Pattern Controls of Summer Temperature Anomalies in Southern Africa
- Attribution of Biases of Interhemispheric Temperature Contrast in CMIP6 Models
- The Spatiotemporal Distribution Characteristics of Cloud Types and Phases in the Arctic Based on CloudSat and CALIPSO Cloud Classification Products
- Impacts of Ice-Ocean Stress on the Subpolar Southern Ocean:Role of the Ocean Surface Current
- Two-Stream Approximation to the Radiative Transfer Equation:A New Improvement and Comparative Accuracy with Existing Methods