
Accuracy analysis of iron content of galvanized coating using an X-rayfluorescence spectrometer with an L-spectrum
2024-01-11 11:52:56
Baosteel Technical Research 2023年4期
Products &Technique Management Department,Baoshan Iron &Steel Co.,Ltd.,Shanghai 201900,China
Abstract:The accuracy (repeatability and reproducibility) of the iron content analysis of galvanized coating using an X-ray fluorescence spectrometer with an L-spectrum is not better than that of flame atomic absorption spectrometry,sometimes it exceeds the quality control limit.Influences,such as current,voltage,equipment (internal circulating water,10%CH4+90%Ar,and vacuum) checking,instrument monitoring,sample cleaning,and oper-ators,were investigated by means of 6-sigma and lean operations to improve accuracy.
Key words:X-ray fluorescence spectrometer; L-spectrum; galvanized coating; iron content
1 Introduction
Zinc-iron alloy steel plates,which have good stamping formability,corrosion resistance,welding ability,and coating ability,are commonly used as automobile plates.The different objectives of auto-mobile part manufacturing can be met by control-ling the iron content in galvanized coating[1].The standard method for detecting the iron content in the galvanized coating is a chemical method (GB/T 24514-2009 Zinc and/or aluminum-based coatings on steel-Determination of coating mass per unit area and chemical composition-gravimetry,inductively coupled plasma atomic emission spectrometry and flame atomic absorption spectrometry).In this method,the coating on one side of the base steel is stripped using a mixture of hydrochloric acid solu-tions containing an inhibitor to prevent attack on the base steel.The mass per unit area of the coating is determined based on the mass difference of the specimen before and after stripping divided by the specimen’s surface area.The stripped solution of the coating on one side is then diluted.The solution is filtered and nebulized into an inductively coupled plasma atomic emission spectrometer or a flame atomic absorption spectrometer.The chemical compo-sition of the coating layer is calculated as the content of the analytical element divided by the premeasured coating mass.The above method is a destructive method and includes many operation steps as well as a long measurement time.In the presence of num-erous samples,this chemical method cannot meet the quality inspection and release cycle requirements of the galvanizing unit.
Thus,we attempted to replace the destructive chemical method with the nondestructive L-spec-trum X-ray fluorescence method.However,the accuracy of iron content of galvanized coating isn’t improved and sometimes it exceeds the quality control limit.
Influences,such as current,voltage,equipment (internal circulating water,10%CH4+90%Ar,and vacuum) checking,instrument monitoring,sample cleaning,and operators,were investigated by means of 6-sigma and lean operations to improve the accuracy of the analysis of the iron content of galv-anized coating using an X-ray fluorescence spectro-meter with the L-spectrum.
2 Experimental setup
2.1 Instruments and measurement conditions
X-ray fluorescence spectrometer (Rigaku),type ZSX primus:X-ray light tube,shielding plate Rh;line,Fe Lα;collimator mask (sample cup),30 mm;analysis medium,vacuum;wave splitter,differen-tiation.
2.2 Sample preparation
The GA sheet sample was punched into a round sheet sample (φ50 mm).The surface of the sample was clean and smooth without obvious scratches.
3 Analysis of primary causes
3.1 Effect of the current and voltage on accuracy
The common current and voltage of the X-ray fluorescence spectrometer are 50 kV/50 mA.Given that the intensity of line Fe Lα is considerably weaker than that of line K,we selected 25 kV/150 mA to improve the accuracy of detection.
3.1.1 Effect on repeatability
Table 1 shows the repeatability of thet-test when the current and voltage were 25 kV/150 mA and 50 kV/50 mA.
Significant differences were found in repeatability at different currents and voltages (P=0.005,<0.05).Repeatability at 25 kV/150 mA was better than that at 50 kV/50 mA.
3.1.2 Effect on reproducibility
Table 2 shows the reproducibility of thet-test when the current and voltage were 25 kV/150 mA and 50 kV/50 mA,respectively.

Table 2 Reproducibility of the t-test at different currents and voltages
3.2 Effect of measurement time on accuracy
The original timing was 4 s for the main body and 5 s for the background.We doubled the measure-ment time to confirm the effect of measurement time on precision.
3.2.1 Effect on repeatability
Table 3 presents the repeatability of thet-test when the main time/background time was 4 s/5 s and 8 s/10 s,respectively.

Table 3 Repeatability of the t-test with different measure-ment time
Significant differences in repeatability were found at different measurement time (P=0.004,<0.05).The repeatability with a long time (main time of 8 s,background time of 10 s) was better than that with a short time (main time of 4 s,background time of 5 s).
3.2.2 Effect on reproducibility
Table 4 shows the reproducibility of thet-test when the main time/background time was 4 s/5 s and 8 s/10 s,respectively.

Table 4 Reproducibility of the t-test with different measure-ment time
Significant differences in reproducibility were found between different measurement time (P=0.003,<0.05).Repeatability with a long time (main time of 8 s,background time of 10 s) was better than that with a short time (main time of 4 s,background time of 5 s).
3.3 Effect of equipment checking on accuracy
Equipment checking is mainly performed to determine whether the hardware and software of the equipment meet the relevant requirements to ensure the accuracy of the test results.If equipment checking is not effective enough to identify errors,the equipment cannot run normally.
The procedural analysis of the influence of equipment checking on accuracy is shown in Fig.1.
Equipment checking is a prerequisite for ensuring the normal operation of the equipment and has some impact on the accuracy of the equipment.Equip-ment status can be monitored using internal control samples,and the test results must be within the tolerance before sample testing.Therefore,equip-ment checking such as the internal circulating water,PR gas,and vacuum is not significant influence.
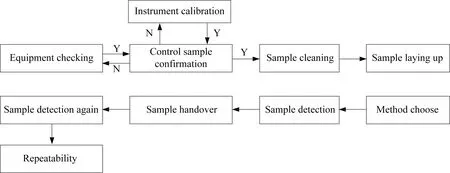
Fig.1 Procedural analysis of the influence of equipment checking on accuracy
3.4 Effect of instrument monitoring on accuracy
Instrument monitoring can correct the data devia-tion caused by the change in X-ray fluorescence intensity.When an internal control sample exceeds the quality control limit,the detection results must be adjusted by drift correction.In this experiment,we observed the effect of instrument monitoring on accuracy by performing or not performing instru-ment monitoring before detection.
3.4.1 Effect on repeatability
The repeatability of thet-test with or without instrument monitoring before detection is shown in Table 5.
Significant differences in repeatability were found with and without instrument monitoring (P=0.015,<0.05).The repeatability without instrument moni-toring was better when the equipment was stable.Therefore,instrument monitoring is unnecessary if the result of the internal control sample is qualified.

Table 5 Repeatability of the t-test with or without instru-ment monitoring
3.4.2 Effect on reproducibility
The reproducibility of thet-test with or without instrument monitoring before detection is shown in Table 6.

Table 6 Reproducibility of the t-test with or without instru-ment monitoring
3.5 Effect of sample cleaning on accuracy
The surface of the GA sheet was coated with an oil film to protect it from rust.The samples were cleaned with ethyl alcohol to confirm the effect of sample cleaning on accuracy.
3.5.1 Effect on repeatability
The repeatability of thet-test when the samples were cleaned with ethyl alcohol or not before detection is shown in Table 7.
Significant differences in repeatability were observed when samples were cleaned with ethyl alcohol and not (P=0,<0.05).Repeatability with sample cleaning was better.
3.5.2 Effect on reproducibility
The reproducibility of thet-test (double sample) when the samples were cleaned with ethyl alcohol or not before detection is shown in Table 8.

Table 8 Reproducibility of the t-test (double sample) with or without sample cleaning
Significant differences in reproducibility were found when samples were cleaned with ethyl alcohol or not (P=0,<0.05).Reproducibility with sample cleaning was better.Therefore,samples should be cleaned with ethyl alcohol before detection.
3.6 Effect of operators on repeatability
Two operators were chosen randomly for repeat-ability detection with the same batch of samples to confirm the effect of operators on repeatability.Variance analysis is shown in Table 9.

Table 9 Variance analysis of repeatability between different operators
The potential influences on the accuracy of the analysis of the iron content of galvanized coating are shown in Table 10.
4 Comparison before and after improve-ment
By optimizing influences,such as current/voltage,measurement time,and sample cleaning,we compared the accuracy before and after improve-ment,as shown in Table 11.
4.1 Comparison of repeatability before and after improvement
The comparison of repeatability before and after improvement is shown in Fig.2.
Significant differences were found in repeatability before and after improvement (P=0.012,<0.05).The mean value and range after improvement were less than those before improvement.
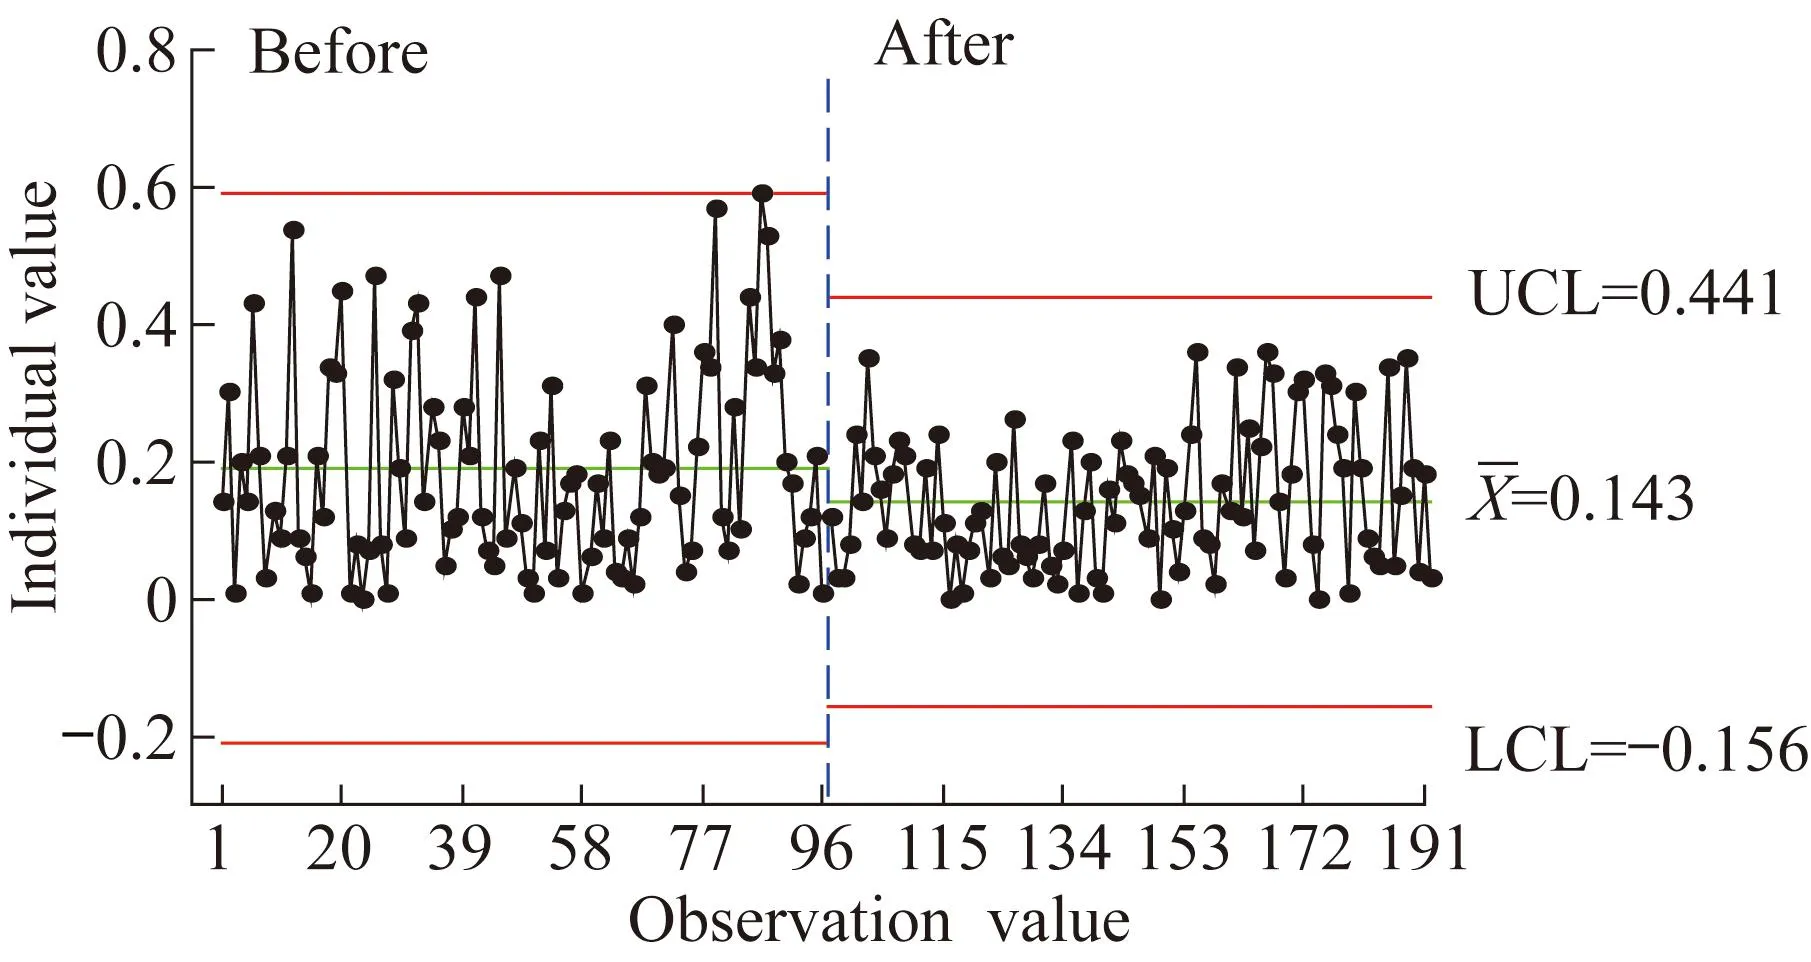
Fig.2 Repeatability of individual observations
4.2 Comparison of reproducibility before and after improvement
The comparison of reproducibility before and after improvement is shown in Fig.3.
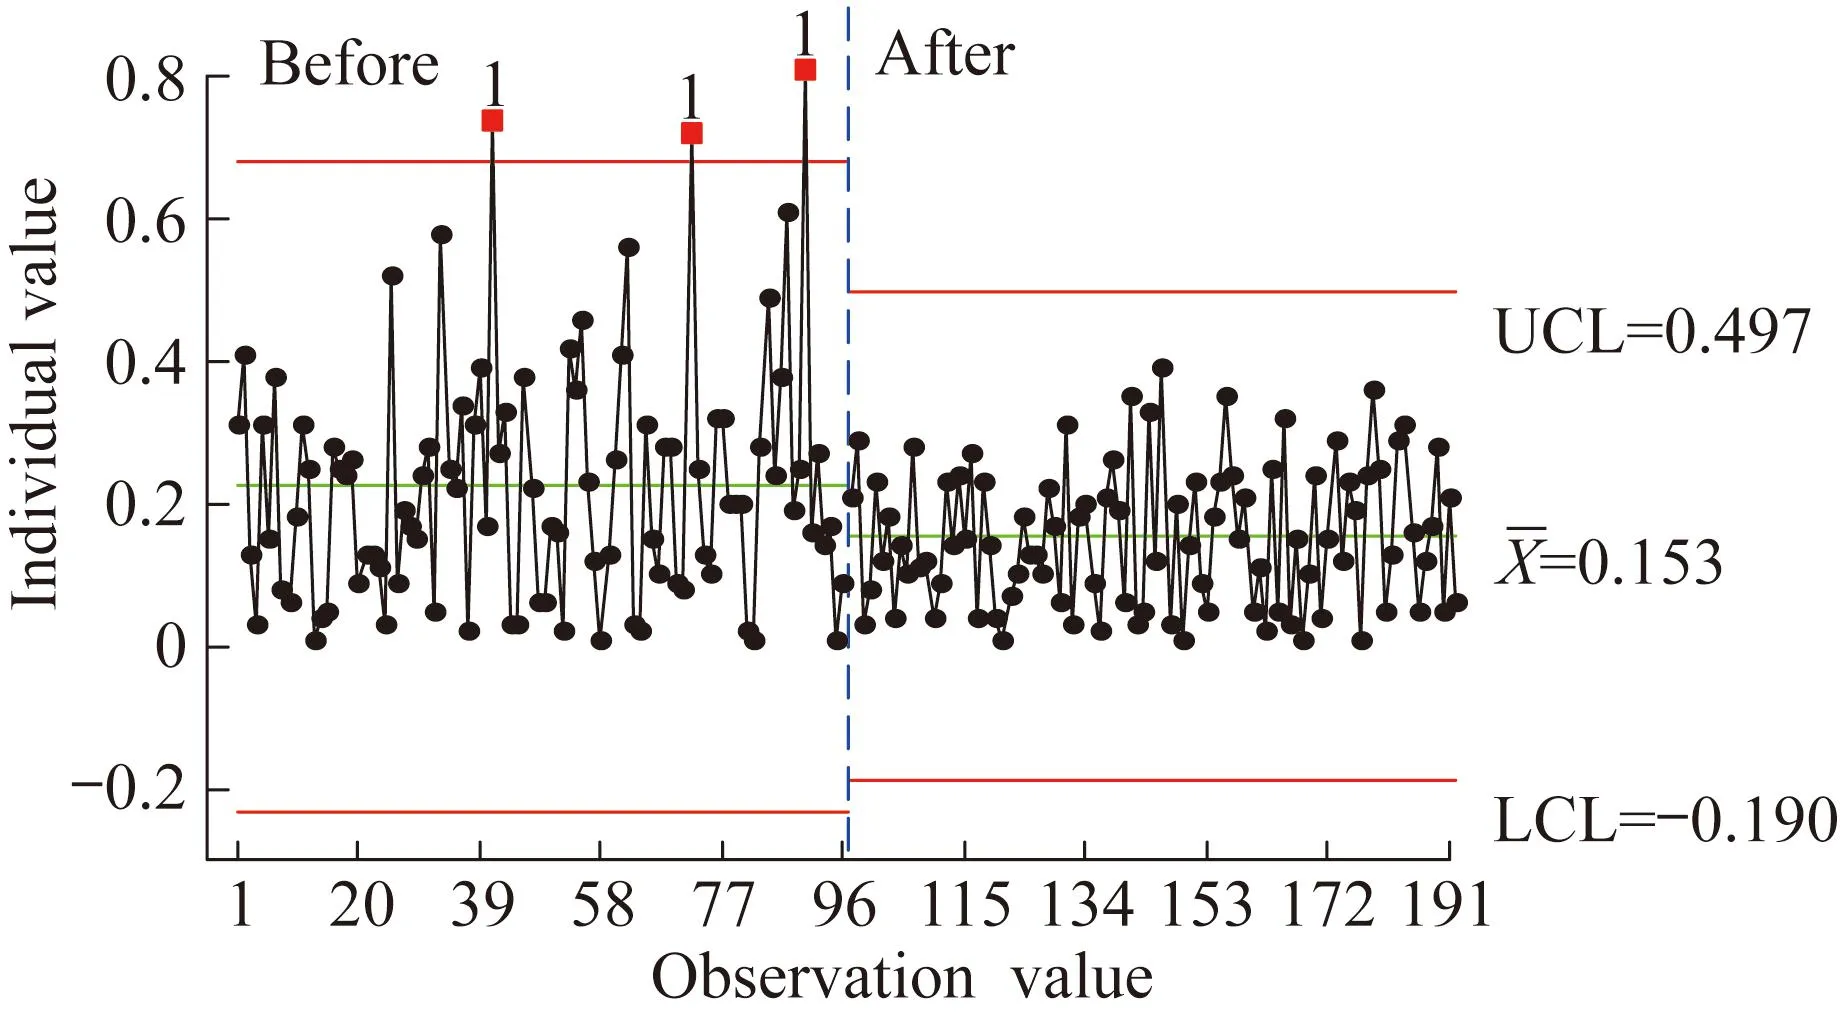
Fig.3 Reproducibility of individual observations
Significant differences were found in repro-ducibility before and after improvement (P=0.001,<0.05).The mean value and range after improve-ment were lower than those before improvement.No outliers were found.
5 Conclusions
Through a series of experiments,we identified four significant influences (current/voltage,measurement time,instrument monitoring,and sample cleaning) on the accuracy of the iron content analysis of galvanized coating.The accuracy can be signifi-cantly improved by adjusting the voltage,pro-longing the measurement time,and cleaning samples with ethyl alcohol.
 Baosteel Technical Research2023年4期
- Baosteel Technical Research的其它文章
- Failure analysis of the needle valve body of R18CrNi8 steel
- Research progress on protective coatings against molten nitrate salts for thermal energy storage in concentrating solar power plants
- Effect of quenching and tempering processes on properties and microstructure ofG115 steel
- Study on gas metal arc welding of two types of TMCP steels
- Effect of lump ore ratio on the metallurgical properties of blast furnace charge
- List of winners of excellent papers of Baosteel TechnicalResearch in 2023