
An improved bearing fault detection strategy based on artificial bee colony algorithm
2022-12-31 03:44:36HaiquanWangWenxuanYueShengjunWenXiaobinXuHansDietrichHaasisMenghaoSuPingliuShanshanZhangPanpanDu
Haiquan Wang|Wenxuan Yue|Shengjun Wen|Xiaobin Xu|Hans‐Dietrich Haasis|Menghao Su|Ping liu|Shanshan Zhang|Panpan Du
1Zhongyuan Petersburg Aviation College,Zhongyuan University of Technology,Zhengzhou,China
2Faculty of Electrical and Engineering,Zhongyuan University of Technology,Zhengzhou,China
3School of Automation,Hangzhou Dianzi University,Hangzhou,China
4Maritime Business and Logistics,University of Bremen,Bremen,Germany
Abstract The operating state of bearing affects the performance of rotating machinery;thus,how to accurately extract features from the original vibration signals and recognise the faulty parts as early as possible is very critical.In this study,the one‐dimensional ternary model which has been proved to be an effective statistical method in feature selection is introduced and shapelet transformation is proposed to calculate the parameter of one‐dimensional ternary model that is usually selected by trial and error.Then XGBoost is used to recognise the faults from the obtained features,and artificial bee colony algorithm(ABC)is introduced to optimise the parameters of XGBoost.Moreover,for improving the performance of intelligent algorithm,an improved strategy where the evolution is guided by the probability that the optimal solution appears in certain solution space is proposed.The experimental results based on the failure vibration signal samples show that the average accuracy of fault signal recognition can reach 97%,which is much higher than the ones corresponding to traditional extraction strategies.And with the help of improved ABC algorithm,the performance of XGBoost classifier could be optimised;the accuracy could be improved from 97.02% to 98.60% compared with the traditional classification strategy.
KEYWORDS fault diagnosis,feature extraction,improved artificial bee colony algorithm,improved one‐dimensional ternary pattern method,shapelet transformation
1|INTRODUCTION
Rolling element bearings,as high‐precision components allow the rotating machine to run at extremely high speed,have been widely used in various precision instruments[1].But due to the influence of overheating or overloading as well as the friction between different mechanical parts,different types of failures often occur which eventually cause motor failures,lead to high maintenance costs,serious economic losses and safety hidden dangers[2].Therefore,the diagnosis of bearing faults and the prediction of the effective life of machine are of great significance[3,4].Different from the traditional bearing fault diagnostics which could be realised by constructing the physical model of bearing faults[5],with the development of artificial intelligent technology,the strategies of signal processing and data mining based on the measurable signals captured by a variety of sensors attract the interest of many researchers[6,7],where feature extraction should be executed first for identifying the most discriminating characteristics in signals.Actually,several time‐domain or frequency‐domain or time‐frequency domain analysis methods such as spectral analysis[8,9],cyclostationary approach[10],fast Fourier transform[11,12],wavelet transform[13]and so on are used to extract useful features from signals.However,since the vibration signal itself is a noisy non‐linear signal,these methods are prone to the problems of high time complexity and low noise filtering performance when processing these signals[14,15].In order to better solve the problem of signal noise,Melih Kuncan et al.proposed a new vibration signal feature extraction method named one‐dimensional ternary pattern(1D‐TP)[16]which could fully describe all the characteristics of the obtained signals and extract effectively in real time if the characteristics of fault signals change.However,the establishment of ternary pattern needs to determine the values of centre pointpand thresholdβwhich are often selected by trial and error.In this paper,with the help of shapelet transformation[17,18],which is used for extracting similar subsequences,pandβare calculated as the centre of the shapelets and the standard deviation of shapelets,respectively,and the performance of 1D‐TP as well as the accuracy of feature extraction could be improved.
Based on the extracted features,an effective classification strategy needs to be introduced.XGBoost,which is constructed with boosting trees,has proven their superiority in many classification applications[19,20].However,the selection of parametersoftheXGBoost,suchasthelearning rateandthenumberof weakclassifiers,alwaysreliedonexperiences.Inorder toimprove its performance,intelligent optimisation algorithms are introduced.Chen et al.proposed a combined prediction method with LSTM and XGBoost[21],Zhang et al.proposed the genetic algorithm_XGBoost model,where the optimisation ability of genetic algorithm was used to perform multiple searches on the parameter combination of XGBoost to obtain an optimal solution[22],the improved particle swarm optimisation algorithm was used to optimise the XGBoost parameters,and a machine learning model was established to predict the tensile strength and plasticity of steel[23].In this paper,a more efficient optimisation strategy named artificial bee colony algorithm which is developed byKaraboga[24,25]is introduced.It is based on simulating the foraging behaviour of honey bee swarm,and the numerical comparisons demonstrated that the performance of ABC algorithm is competitive to other population‐based algorithms with anadvantageofemployingfewercontrolparameters[26,27].For overcoming thedisadvantage of easily getting trapped inthe local optimal when solving complex multimodal problems[28],different from combining it with other algorithms[29,30],an improved bee colony algorithm where the search is guided with the important indices of sub‐region is proposed.
The rest of the study is organised as follows.In Section 2,a brief introduction about the bearing fault is provided.Then,a new feature extraction method combined 1D‐TP with shapelet transformation is proposed in Section 3.In Section 4,an improved ABC algorithm is created and applied to optimise XGBoost classifier.Relative experiments are exectued in Section 5;the performance of the proposed feature extraction method and the improved ABC‐XGBoost are verified.Finally the content of the paper is summarised and analysed,and the future research directions are briefly described.
2|BEARING FAULT DESCRIPTION
A rolling‐element bearing consists of the outer race mounted on the motor cap,the inner race which holds the motor shaft,the rolling elements,and the cage for restraining the relative distances between adjacent rolling elements.The problems such as misalignment,shaft deflection,tilted outer race and tilted inner race are likely to cause the bearing failures.
In order to obtain the bearing fault data,single point faults are introduced by Bearing Data Center in Case Western Reserve University whose diameters are 0.007,0.014,and 0.021 inch,respectively,at the inner raceway,the rolling element and the outer raceway.Vibration data are collected for motor loads from 0 to 3 HP and motor speeds from 1720 to 1797 rpm using two accelerometers installed at both the drive end and fan end of the motor housing[31],and the number of samples per failure type is 600.As shown in Table 1,the samples are constructed with different defect sizes under different fault types;here,NS,IRF,BF and ORF represent normal signal,inner ring fault,ball fault,and outer ring fault,respectively[32].
3|FEATURE EXTRACTION
3.1|One‐dimensional ternary patterns
1D‐TP is developed based on the local ternary pattern[33,34],which is generally used in image processing.Different from directly processing multi‐dimensional matricesin local ternary mode,the patterns obtained from the comparisons between two neighbours of the vibration signals are adopted in 1D‐TP.The procedure of algorithm could be described as follows:
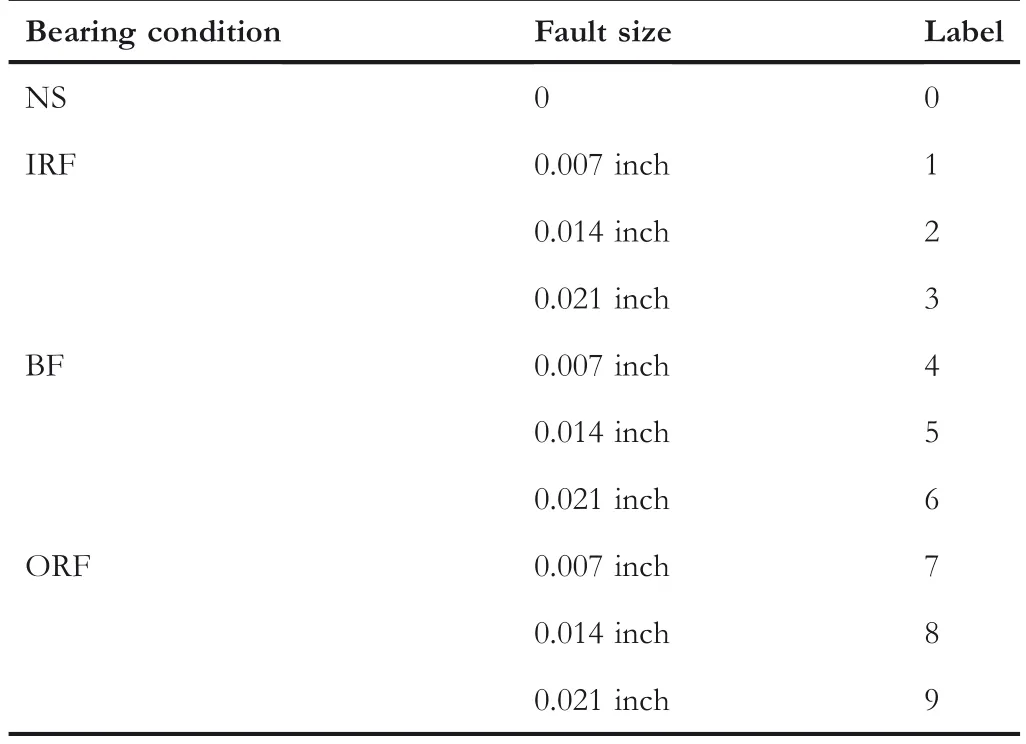
TABLE 1 Characteristics of the sample data
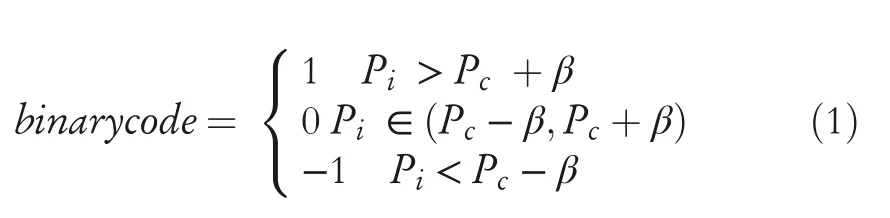
After defining relative parameters,such as the centre point in the transformed vectorPc,the pointPiwithin a specific range aroundPc,as well as the range thresholdβwhich affects the encoding result,the value of member within the threshold rangeβis compared to neighbours as shown in Equation(1),and then ternary patterns code could be generated.
Based on the encoding results,the positive and negative values are separated,and two columns of binary codes could be generated and converted to decimal numbers,which are the central value of signals.Thus,two different sets of feature vectors could be obtained.
The 1D‐TP method can fully describe all characteristics of signals including the oscillation and the steady state.Although it has been proved to be effective in extracting features from raw data,there are still two problems:the first one is how to choose the value of parameterβ,which is often obtained by trial and error to guarantee the best extraction performance.The second one is how to overcome the influence of outliers that exist in the original signals.For improving the performance of 1D‐TP,the shapelet transform strategy is introduced.
3.2|Improved 1D‐TP feature extraction with shapelet transform strategy
The shapelet transformation is a shape‐based time series representation approach,which could identify the local or global similarity of shapes and offer an intuitively comprehensible way of understanding long time series[35].It could be executed with the following steps as show in Figure 1.
First of all,assumeTs={Ts1,Ts2,Ts3……Tsn}is the original time series,randomly divide it and generate a set of shapelet candidatesW={w1,w2,w3……wn}from the time seriesTsand corresponding class labels.
Second,calculate the Euclidean distances,which are the values between all shapelet candidateswiand the time series inTsas Equation(2),and sort them in increasing order to form the setDs.

whereTsis time series,wirepresents the extracted shaplets,andDsis the set of Euclidean distance between the above two parameters.Next,information gain(IG)for each candidate[36]inWcould be calculated as given in Equations(3)and(4);thus,their qualities could be assessed.
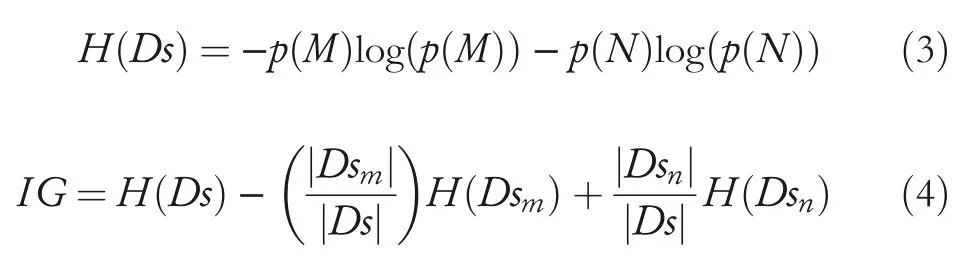
Wherep(M)andp(N)represent the proportion of different fault categoriesMandNin the sample setDs,respectively;DsmandDsnare two subsets inDs.
Finally,shapelets are extracted from the generated candidates by comparing their IG values,and the datasetWthat is composed of the extracted shapelets could be established in descending order.The sequence after shapelet transform is the subsequence with higher fault information.
Through the aforementioned shaplet transform method,the information gain of local subsequence relative to the original signals is compared;thus,the shapelets with the main information of original fault signals could be extracted,and the outliers with little fault information can be removed.
Obviously,for the original data,the influence of outliers could be eliminated with shapelet transformation,and similar local subsequences could be extracted.During the procedure,the standard deviation of local subsequence after shapelet transformation,which is calculated with Equation(5),is assigned to the parameter ofβin ID‐TP;here,wirepresents the transformed shapelets based on its information gain,andnis the number of points in the sequenceW:

Thereby the performance of the one‐dimensional ternary pattern feature extraction method could be improved.The detailed procedure could be described as given in Table 2.
The improved feature extraction method with 1D‐TP and shapelet transform can not only quickly obtain the optimal parameters but also filter out abnormal signals which affect fault recognition.With the extracted features obtained from the improved feature extraction strategy,classification methods will be introduced to detect the bearing faults.

FIGURE 1 Procedure of shapelet transformation
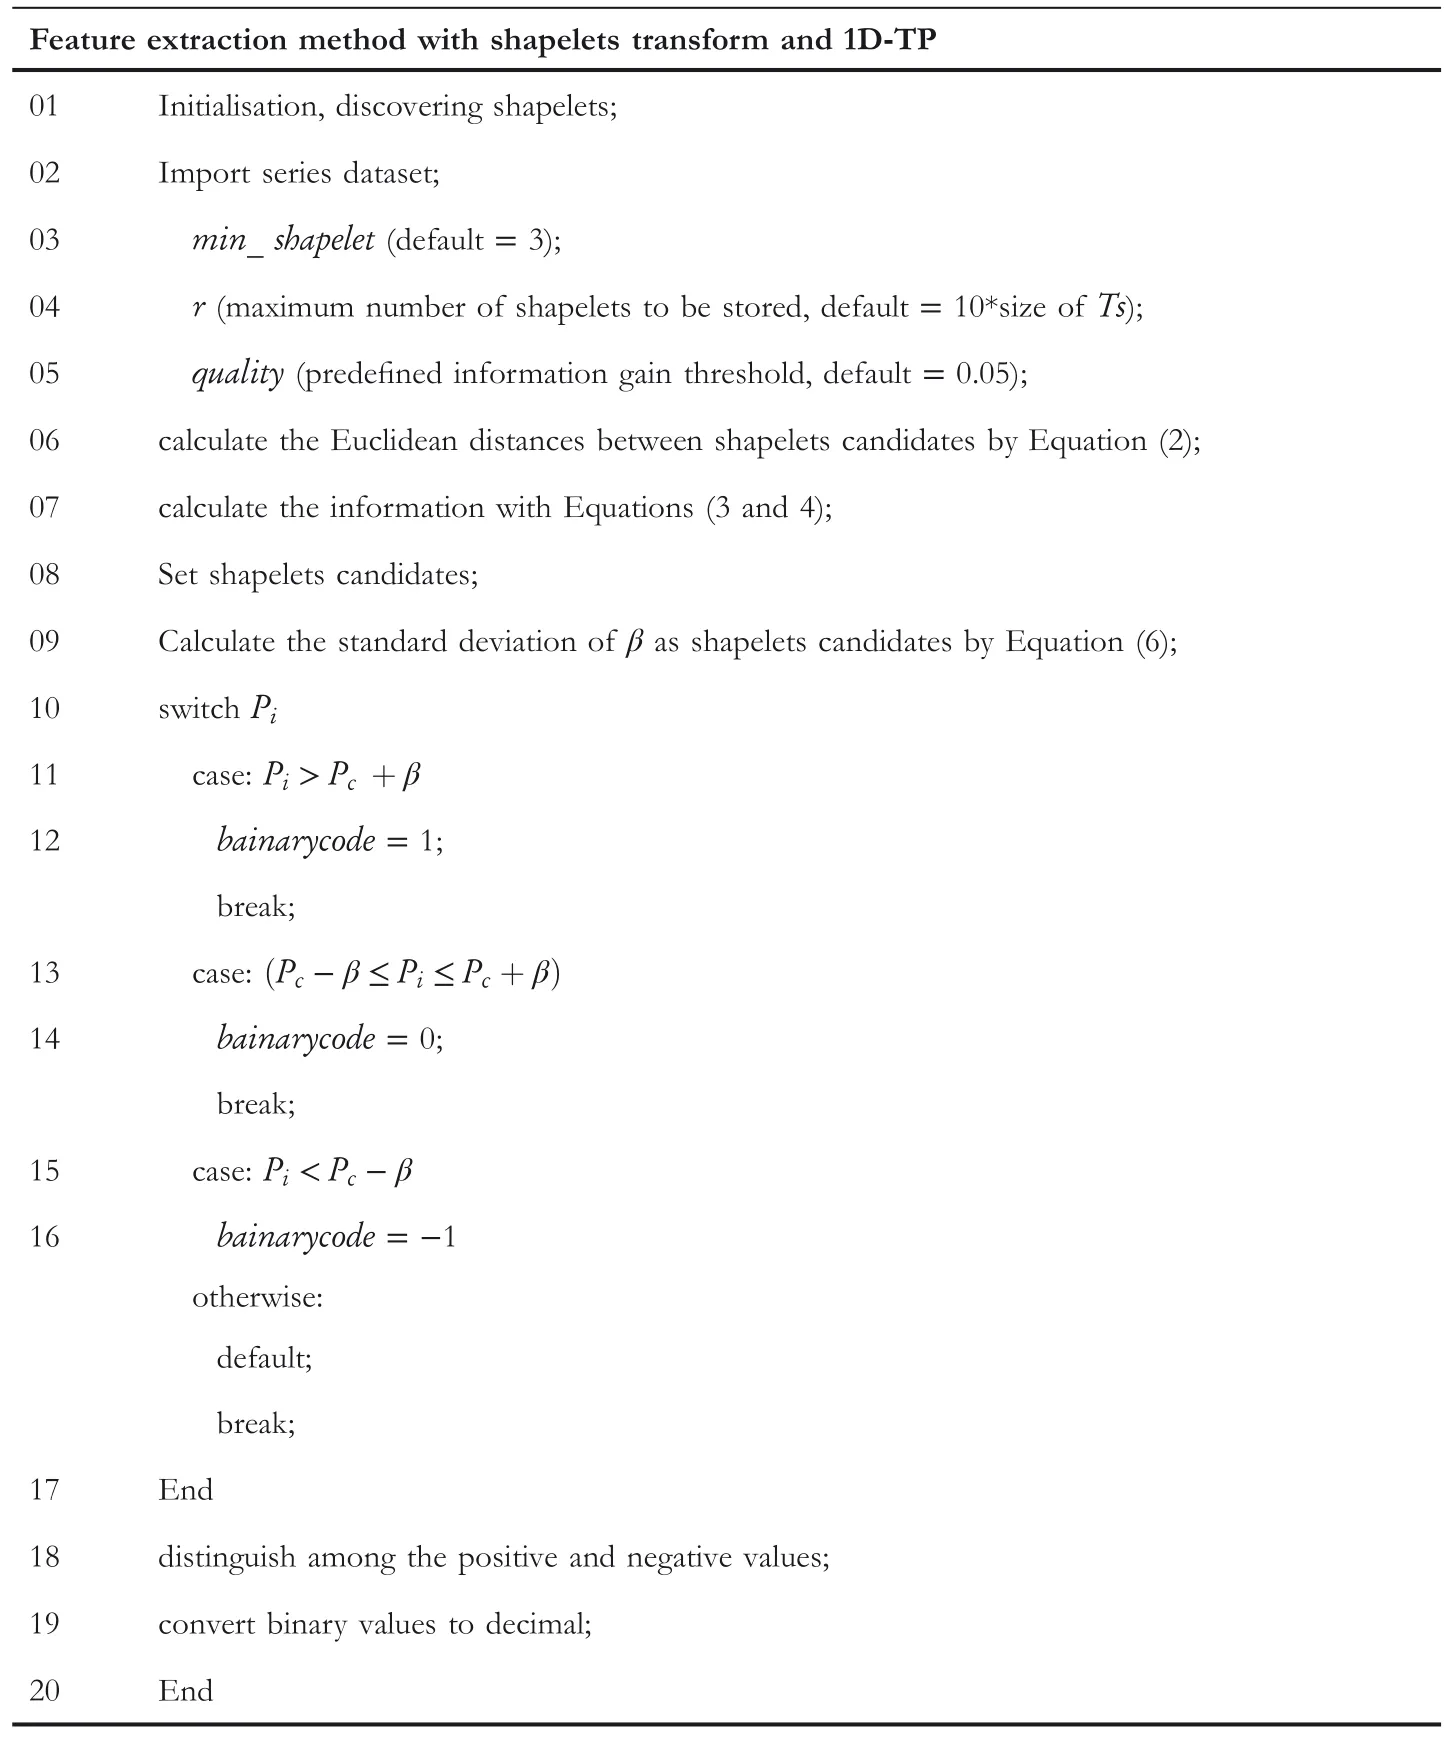
TABLE 2 Pseudo‐code of the proposed method
4|THE IMPROVED CLASSIFICATION STRATEGY
4.1|XGBoost classifier
XGBoost is a highly efficient classification strategy based on gradient boosting decision tree(GBDT),which is widely used in supervised learning problems[37–39].Its basic idea is to combine multiple tree models that possess low classification accuracy to construct a more complex model with relatively high accuracy[40].Compared with the traditional GBDT,the second derivative and regular term are introduced to make the loss function more accurate and avoid tree overfitting,respectively.
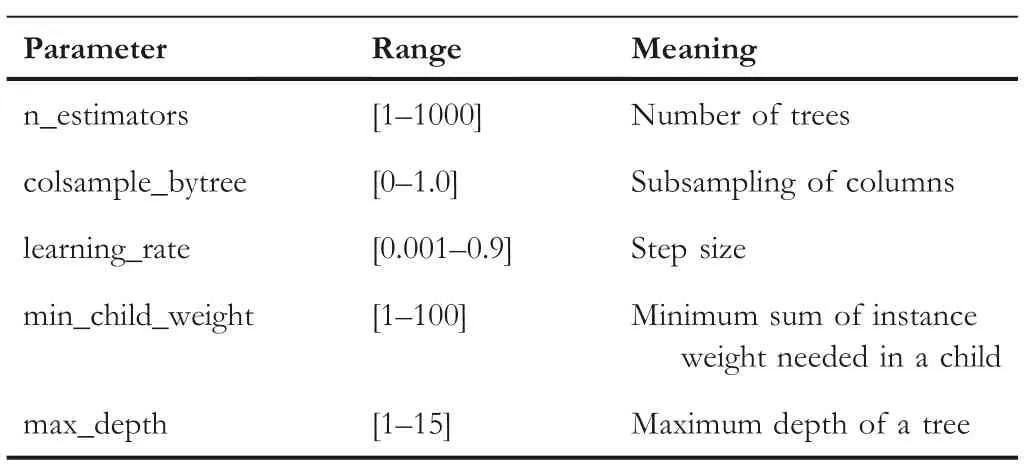
TABLE 3 The parameters and ranges of XGBoost
In the ensemble learning strategy,the selection of classifier parameters directly affects its performance.Table 3 lists the parameters and corresponding ranges that should be optimised in XGBoost.In order to optimise its parameters,the artificial bee colony algorithm,which has been proven to be more competitive than other swarm intelligence algorithms,will be introduced in this paper.
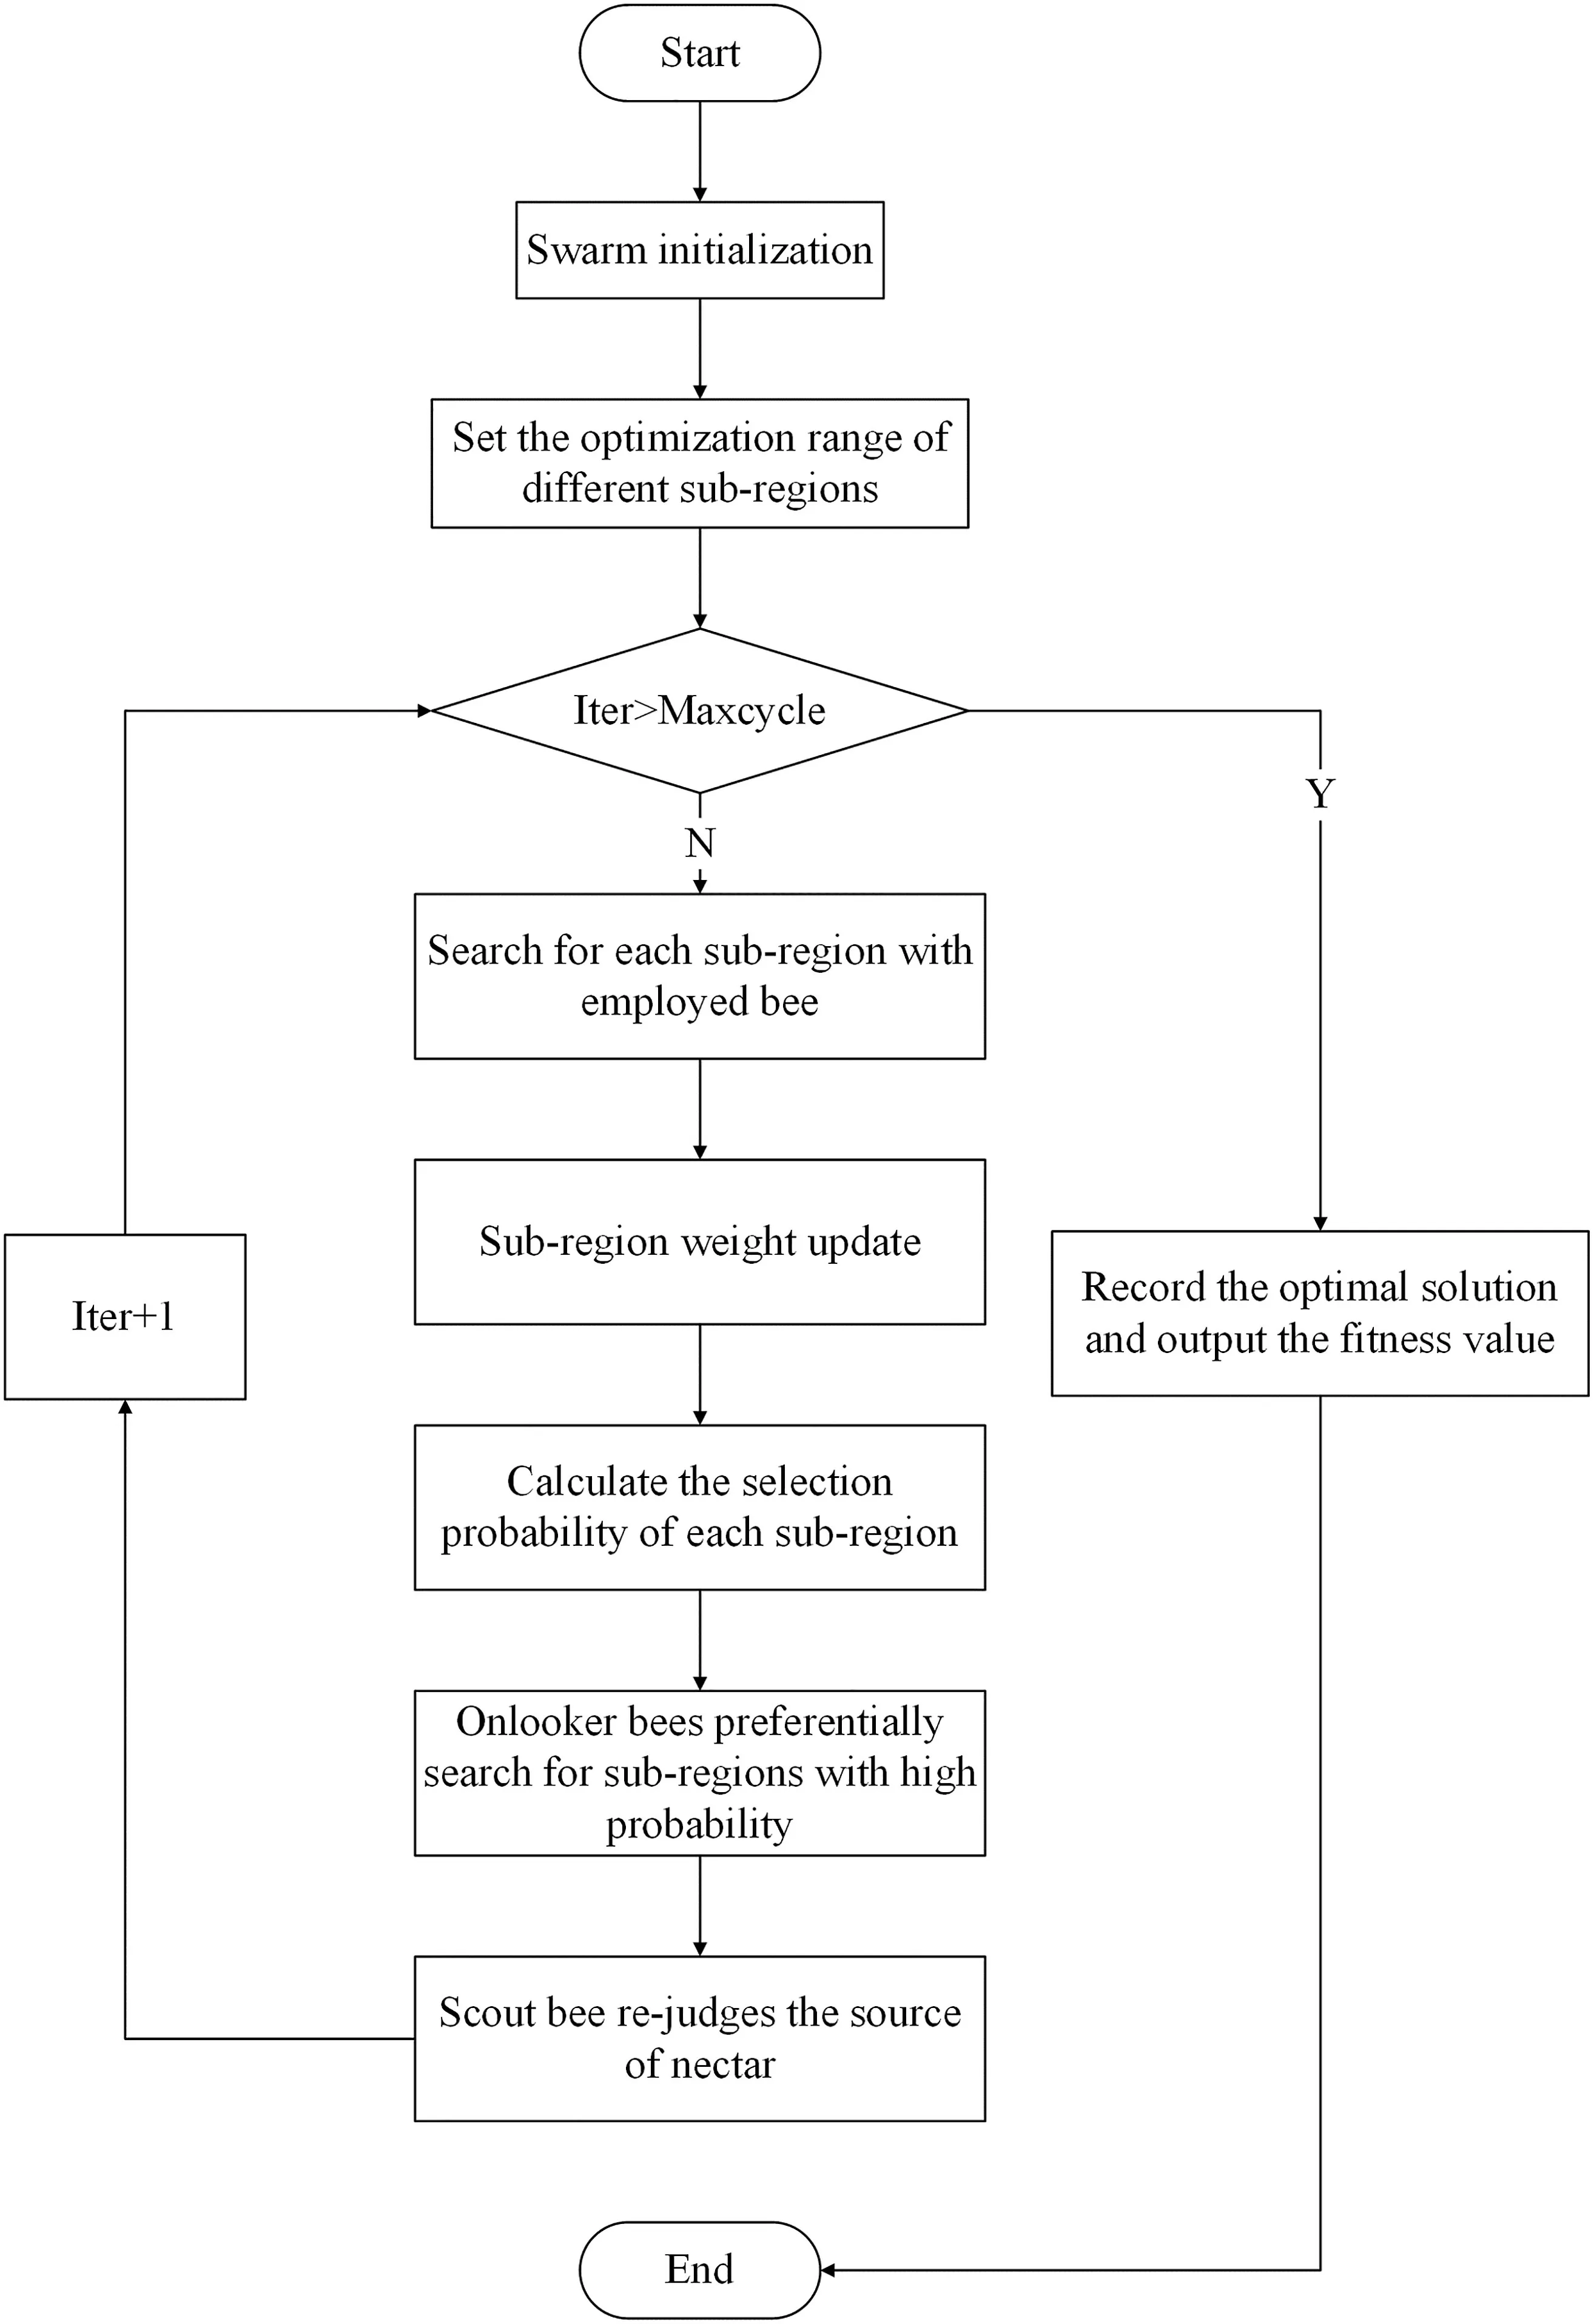
FIGURE 2 Flow chart of adaptive divergence control mechanism
4.2|Improved ABC algorithm
ABC is an optimisation algorithm based on the intelligent foraging behaviour of honey bee swarm which consists of three groups:employed bees,onlooker bees,and scout bees.The optimal solution of the problem is represented by the location of the food source,and the quality of solution could be measured with the value of fitness function.
The traditional algorithm iteratively optimises from the stage of employed bees,traverses each randomly generated solution vector and updates the solution with neighbourhood search as given in Equation(6).Then,according to the selection probability generated with Equation(7),the onlooker bee selects one of the generated solutions to execute the subsequent exploration.
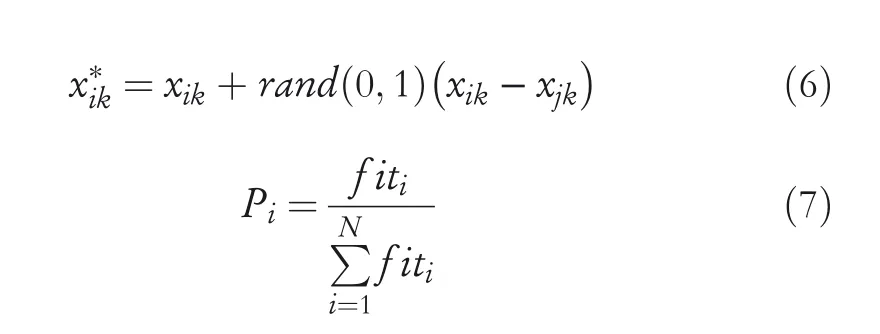
wherexikrepresents the obtained solution,x*ikrepresents new generated solution,andiandjrepresent the indices of specific solution in the population,i,j∈{1,2,…,N},i≠j.krepresents the dimension of the population,k∈{1,2,…,D}.rand(0,1)is a random number between[?1,1],f itiis the fitness value of the objective function,andNis the number of food sources,which is equal to the number of employed bees.Pirepresents the selection probability of each solution vector.
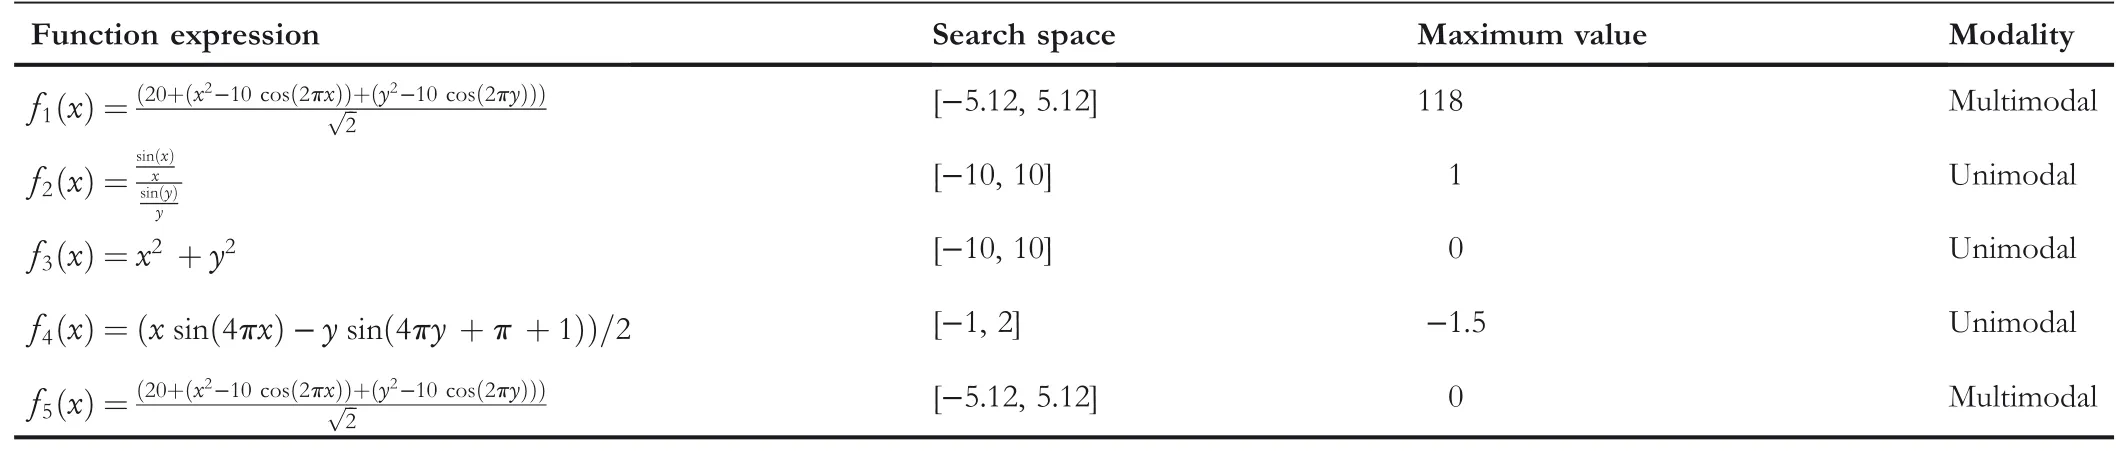
TABLE 4 The benchmark functions
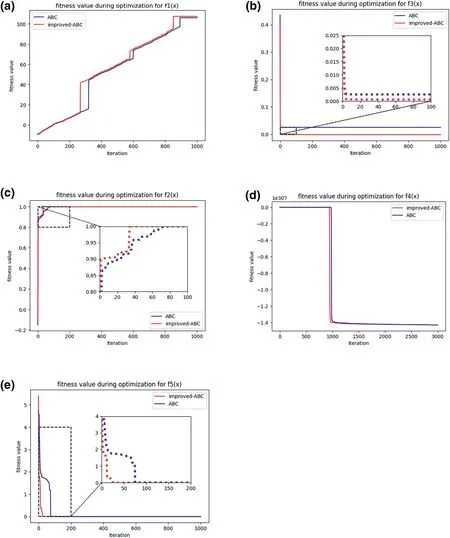
FIGURE 3 Fitness values of five benchmark functions
As mentioned above,the random search and update are executed in the whole solution space and it is easy to fall into the local optimal value.In order to overcome the disadvantage,an adaptive divergence control mechanism is introduced.As shown in Figure 2,the main steps of the improvement are described as follows:
Step1 Initialise the parameters of ABC,set the number of bee colony,the maximum number of iterations and so on.
Step2 Divide the whole solution space intovsub‐regions,which possess the same intervals,and randomly assign weights to different sub‐regions asφ{(diào)θ1,θ2,...,θν}.
Step3 Divide the employed bee into several groups and assign them to different sub‐regions for further exploration,generate a new solutionx*ikaccording to Equation(6)and calculate its fitness value.Based on the fitness value obtained in each sub‐region,the weight of each sub‐region needs to be updated where the sub‐region corresponding to better solution will be assigned to the largest value.
Step4 Calculate the selection probability of each sub‐region according to Equation(8).

Wherej=1,2,...,n,Pjis the value of probability of selection,θjis the weight value corresponding to the sub‐region,andnis the number of all sub‐regions.
Step5 Based on the selection probability of each sub‐region,the onlooker bee selects the sub‐region with larger weight value for further exploration.
Step6 The scout bee judges whether there is a nectar source that needs to be abandoned and if it exists,randomly generates a nectar source to replace it.
Step7 Record the optimal solution until the iterative termination condition is met.
With the above improvement,the improved ABC algorithm executes the searching procedure with the guidance of weights of sub‐region and will increase the search effort for the sub‐region,which possesses higher weight value.Obviously,it will speed up the search for the optimal solution and avoid the misjudgement of the local optimal.
In order to verify the effectiveness of the improved ABC algorithm,five benchmarks from CEC2017 as shown in Table 4 are introduced.The parameters of ABC are set as follows:the total number of bee colony is 200,the maximum number of iterations is set as 1000,and the search range is different from each function.
Figure 3 shows the fitness values corresponding to different algorithms with five benchmarks;Table 5 is thestatistics information of the results.It is clear that the improved ABC possesses better convergence performance than ABC for all the benchmark functions,and the convergence speed increases by 55.7%especially forf2(x).Meanwhile,the results corresponding to the improved algorithm possess better optimisation accuracy,where the fitness value obtained by improved algorithm is a 36.2% reduction with respect to ABC forf3(x).

TABLE 5 Statistics information of different benchmark functions
From the results,the improved bee colony algorithm not only greatly improves the optimisation accuracy compared with ABC but also effectively reduces the time complexity;thus,the effectiveness of the improved ABC algorithm could be verified,and further application on classifier optimisation is possible.
4.3|XGBoost strategy with improved ABC
Based on the improved ABC,the parameters of XGBoost classifier will be optimised with the new framework as shown in Figure 4.The main process is described as Figure 4:
Step1 Import and preprocess the bearing fault data.
Step2 Initialise the relevant parameters of ABC and classifier.
Step3 Divide the solution spaces into different sub‐regions.
Step4 Execute the search with separated groups in different sub‐regions and update the weight values of each sub‐region according to the fitness values of optimal solution searched in that region.Here,the solution is the parameters of XGBoost and the fitness value is the classification accuracy corresponding to each solution.
Step5 Under the guidance of the weights,onlooker bees and scout bees perform the further exploration.
Step6 After reaching the limit of iterations,output the optimal parameters.

FIGURE 4 XGBoost optimisation with improved bee colony algorithm

FIGURE 5 Panel(a)is the confusion matrix with 1D‐TP‐XGBoost and(b)is the confusion matrix with 1D‐TP‐shapelet transform‐XGBoost
5|EXPERIMENTS AND RESULTS
With the bearing fault data mentioned in Section 2,the effectiveness of the improved fault detection method is tested in this part.

FIGURE 6 Panel(a)is the prediction of the test set with 1D‐TP and(b)is the prediction of the test set with 1D‐TP with shapelet transform method
5.1|Comparision of feature extraction method
In order to verify the performance of the improved feature extraction strategy,the XGBoost classifier whose parameters are selected by trial and error is introduced.The corresponding values of XGBoost are set as n_estimators=100 and learning rate=0.1.Figure 5 shows the confusion matrix with 1D‐TP and 1D‐TP‐shapelet transform strategies.The red numbers in the white squares represent the probability of misjudgement of the label,and there are less squares in Figure 5b than that in Figure 5a,which means that the improved feature extraction method possesses better performance.Figure 6 is a histogram that described the actual and the predicted numbers on the test dataset with the two methods.The number of correct predictions for label 2,3 and 8 has increased by 10,10 and 7,respectively,and the number of correct predictions for other labels has also significantly increased.
Figure 7 presents the receiver operating characteristic curves(ROC)with two methods.It is clear that the area below ROC curve corresponding to the improved 1D‐TP method is larger than the other one.
Other feature extraction method such as Fast Fourier Transform(FFT)and wavelet packet transform are also introduced to compare with improved 1D‐TP strategy,and the results are shown in Figure 8 and Table 6.Compared with the traditional time‐domain(Statistical method of time‐domain parameters based on peak‐to‐peak value,mean value and steepness)and frequency‐domain method(FFT),the error rate was reduced by about 18.75%.The accuracy of the improved feature extraction method is about 97%,which is much higher than other methods.It should be noted that since the improved 1D‐TP method does not need to establish a ternary pattern on the entire time series,the required computation time is shorter than 1D‐TP,and the effect of signal outliers is overcomed.
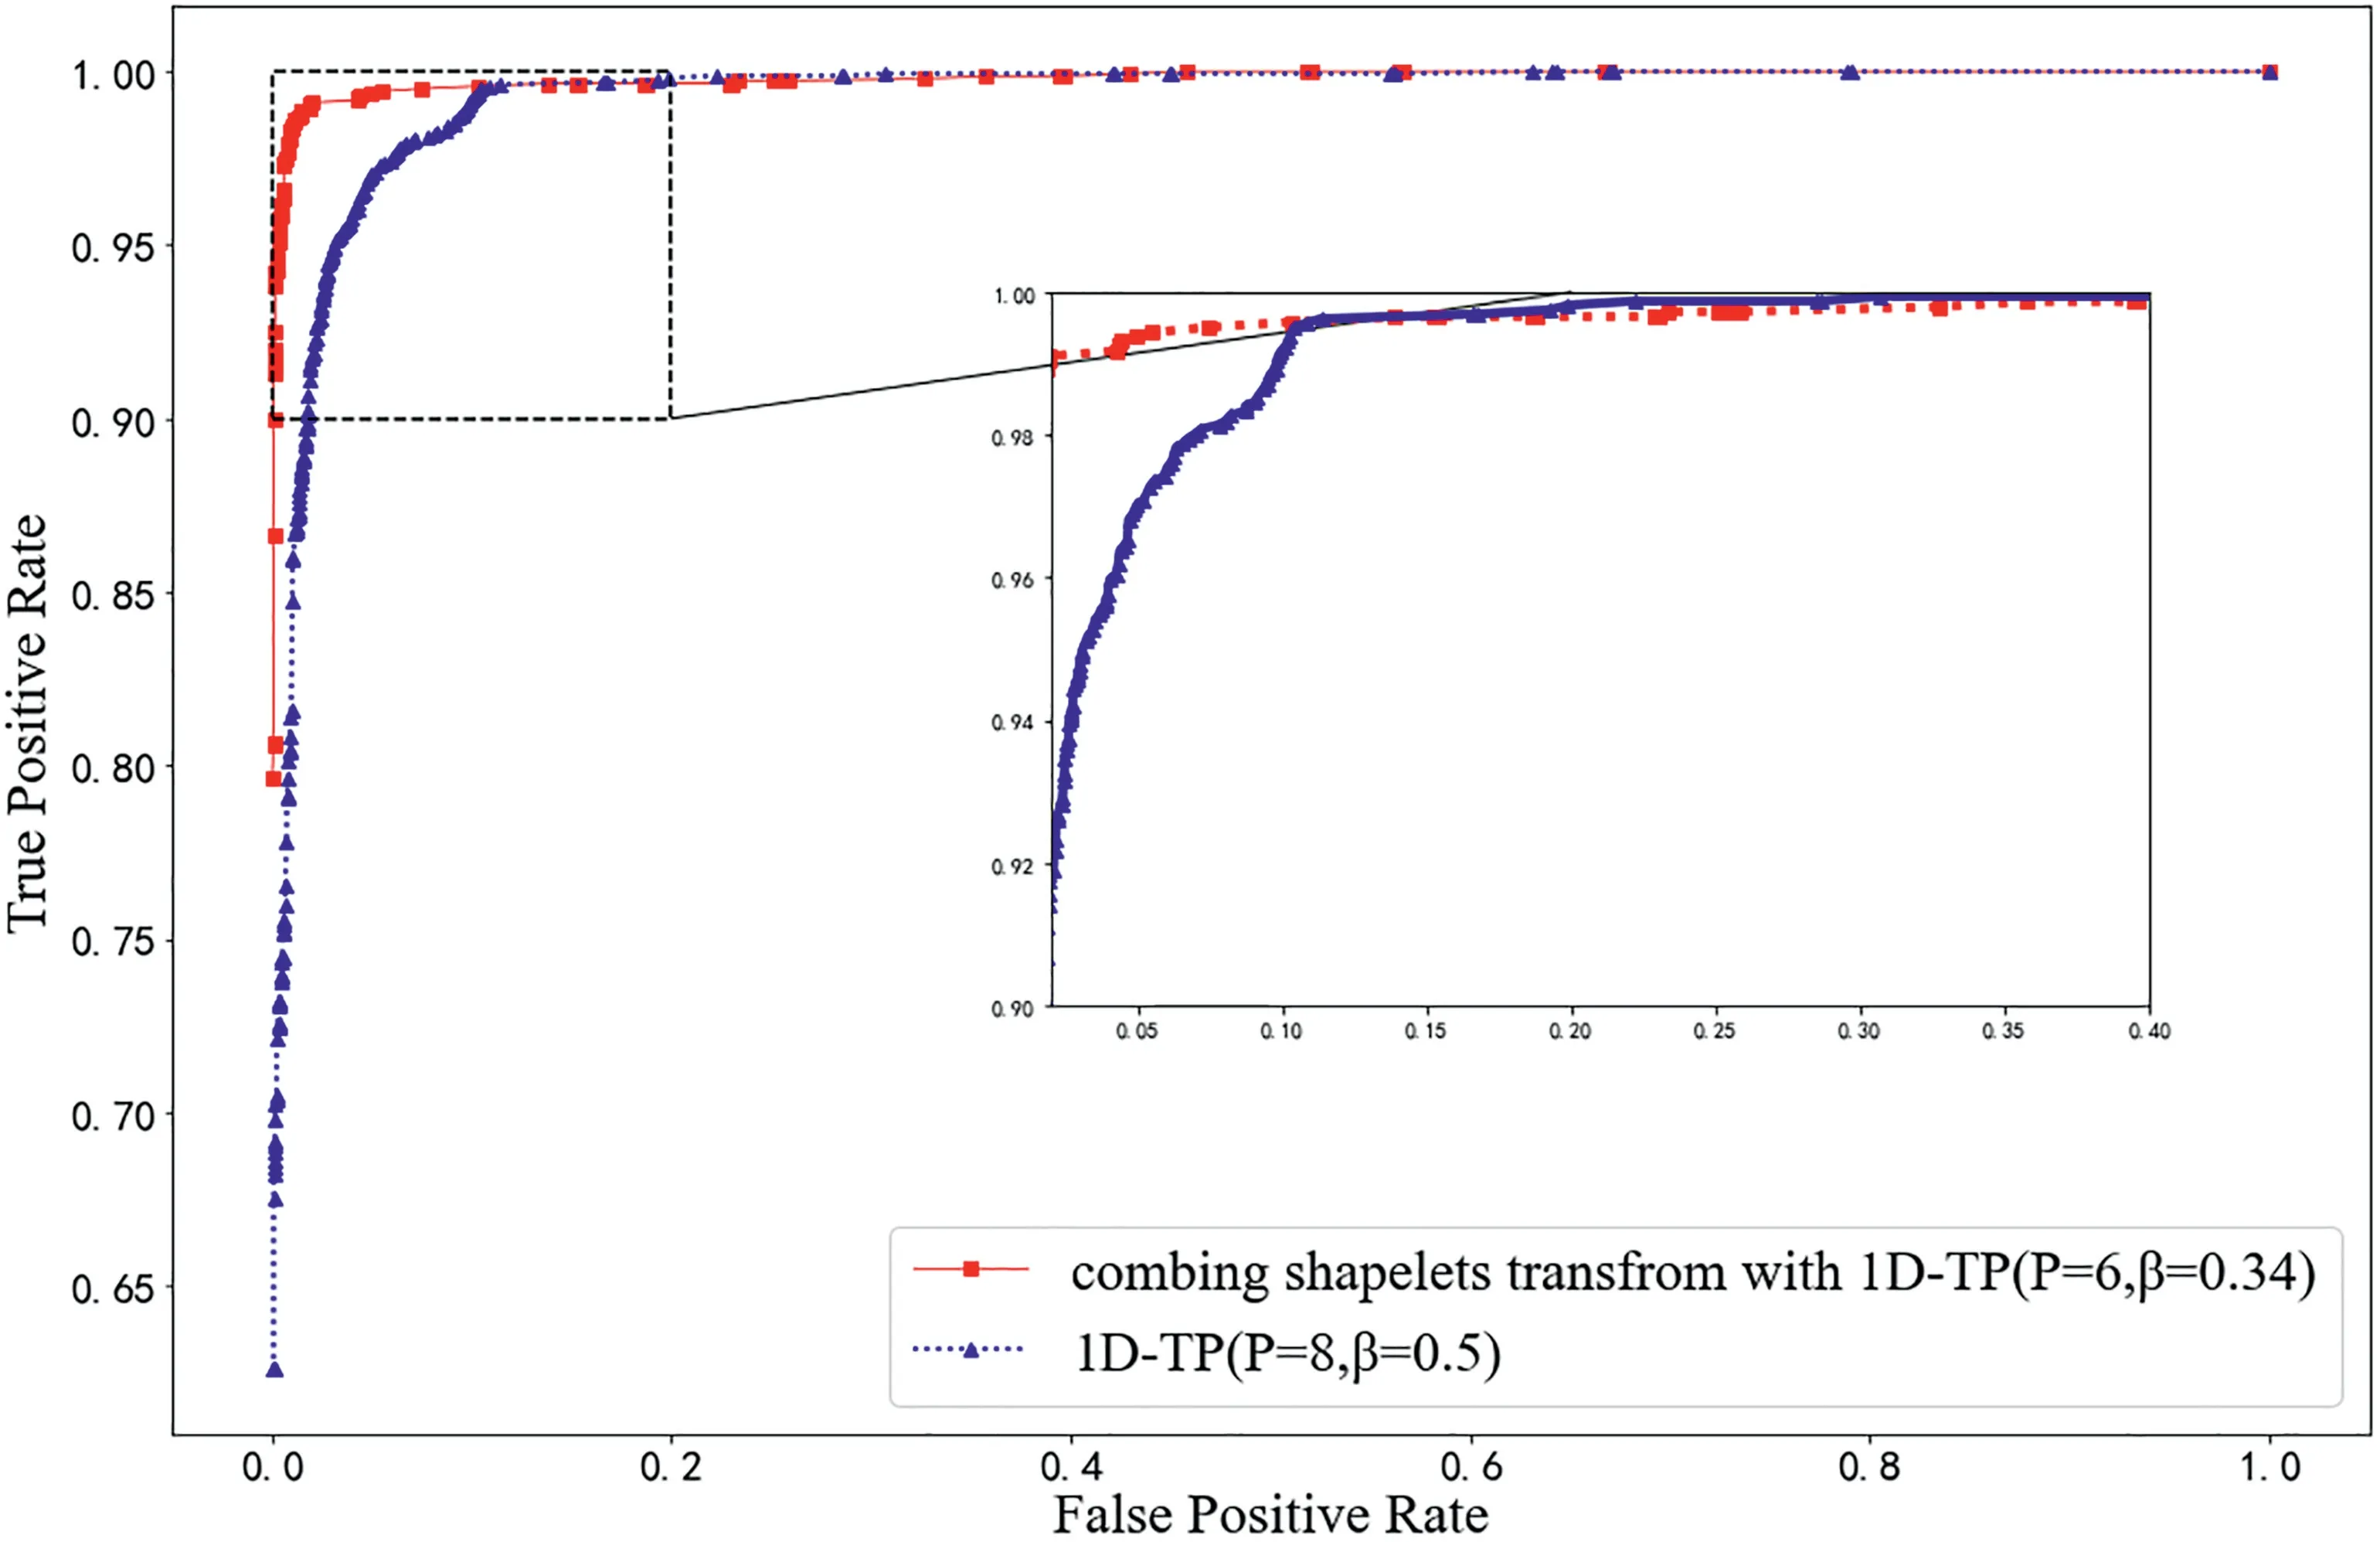
FIGURE 7 Comparison of ROC between the feature extraction methods
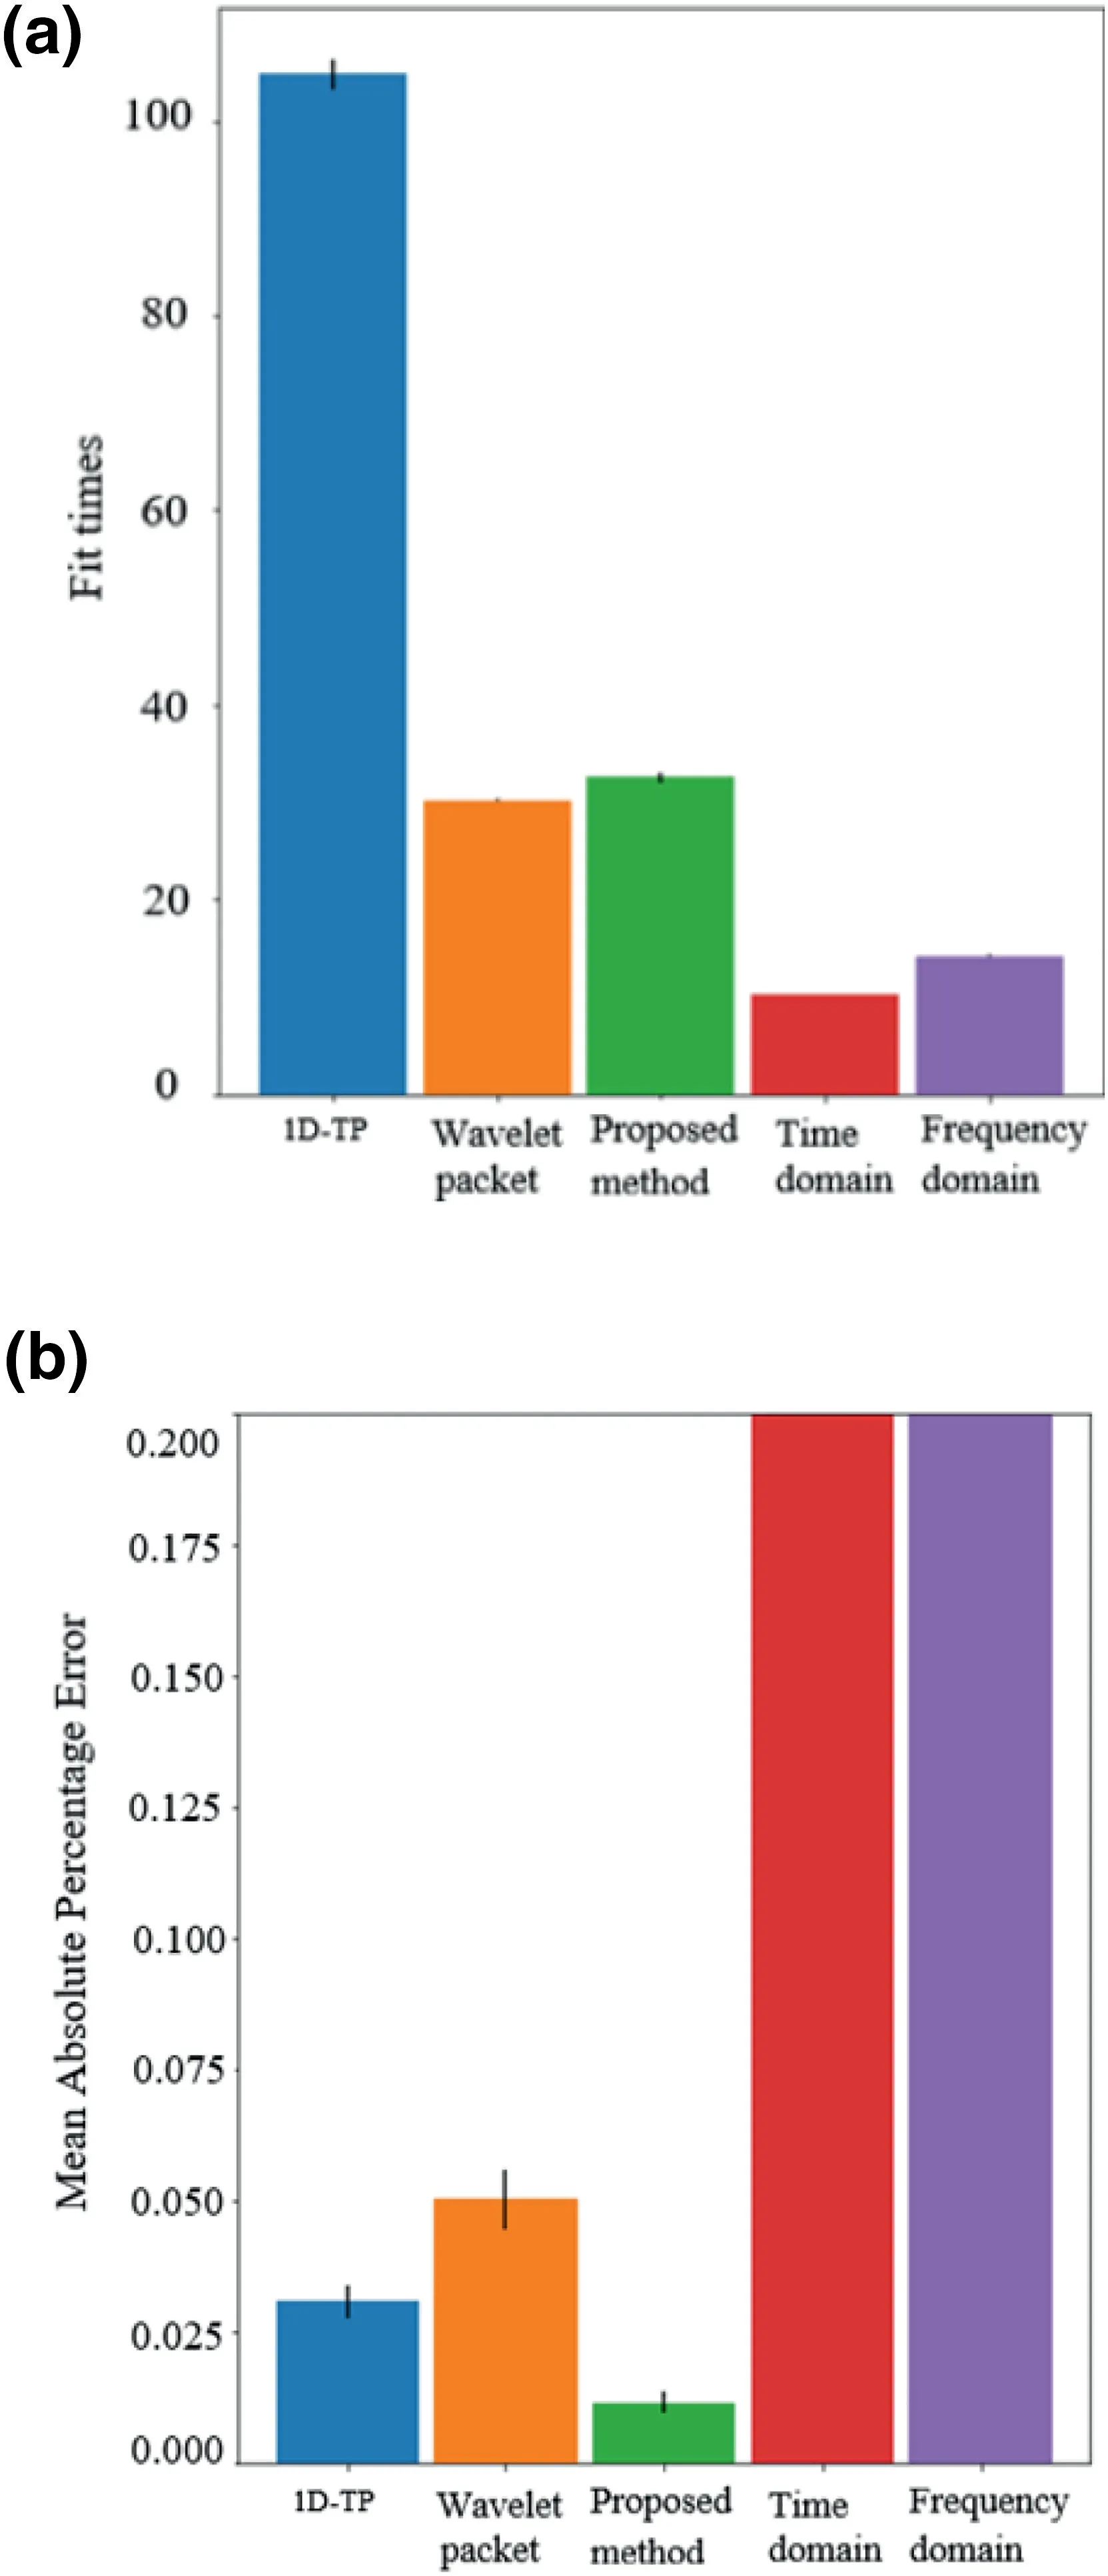
FIGURE 8 Comparison of fit time and error of different feature extraction strategies
5.2|Comparision of XGBoost parameter optimisation
With the shaplet transform‐1D‐TP feature extraction strategy,the improved XGBoost algorithm with ABC proposed in the previous chapter will be further checked.The corresponding parameters of ABC are set as follows:the total number of bee colonies is taken 200,the maximum number of iterations is set as being 1000,the parameters to be optimised are n_estimatorsand learning rate in XGBoost,where the ranges of them are[1,1000]and[0.01,1],respectively.
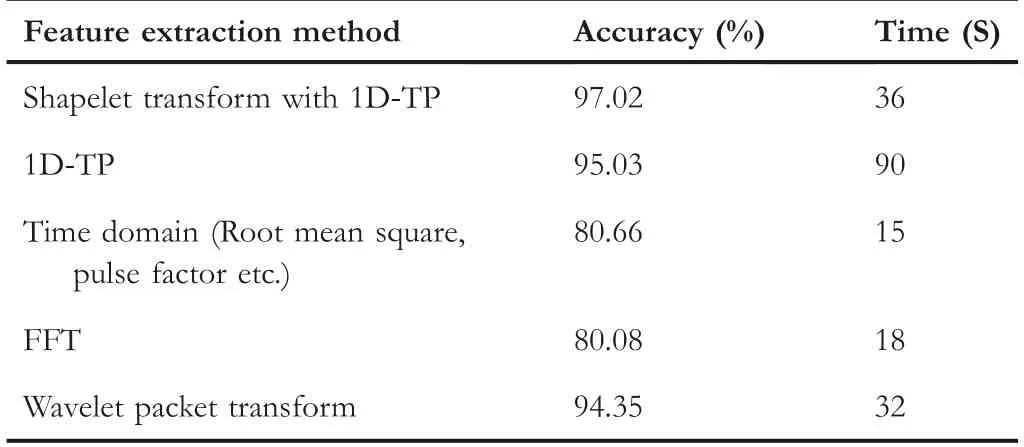
TABLE 6 Accuracy with different feature extraction methods
In order to verify its optimisation performance,traditional XGBoost algorithm,XGBoost with PSO,XGBoost with ABC are introduced and compared with the one corresponding to improved ABC.The iterative optimisation curves are shown in Figure 9.Obviously,compared with the traditional algorithm,the accuracy could be improved by about 1.2%,and the number of iterations could be reduced by 218;it means that the improved ABC‐XGBoost algorithm possesses the best fitness value and fastest convergence speed.
For testing the stability of the proposed algorithm,the optimisation procedure and corresponding classification are executed 10 times,and the results with different intelligent algorithms,such as the average classification accuracy,the average convergence iteration as well as the standard deviation are listed in Table 7.Obviously,the introduction of ABC could improve the performance of XGBoost classifier,and with the help of IABC,the lowest values of standard deviation and the highest classification accuracy could be obtained,which means that the stability and performance of XGBoost with IABC are the best.
6|CONCLUSIONS
For solving the problem of bearing fault detection,the shapelet transform strategy is introduced to improve the performance of traditional 1D‐TP feature extraction method,where the parameters of 1D‐TP that is usually selected by trial and error could be calculated and the influence of outliers in original signals could be overcomed.Meanwhile,an improved ABC algorithm is created where the optimisation is guided with the probability of the optimal solution occurred in certain region,and it is introduced to optimise the performance of XGBoost classifier.The improved algorithms of feature extraction and classification are applied to the problem of bearing fault detection,and the results show the effectiveness of the proposed strategies.
In future work,more advanced machine learning algorithms need to be applied to improve detection accuracy,and multi‐core parallel computing will be used to accelerate the speed of optimisation procedure.
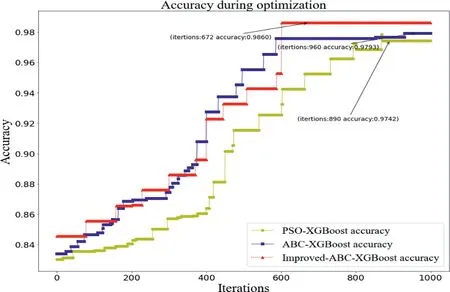
FIGURE 9 Iterative optimisation curves
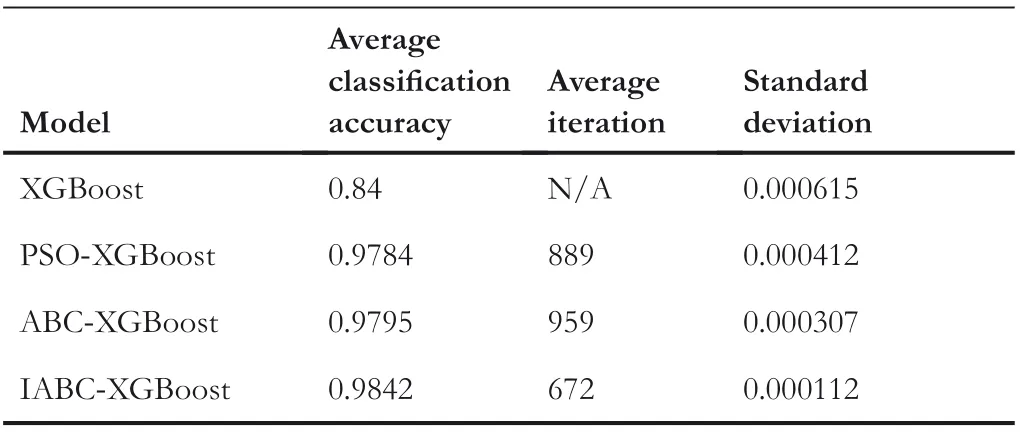
TABLE 7 Classification results
ACKNOWLEDGEMENTS
This work was supported by high‐end foreign expert programme of Ministry of Science and Technology G2021026006L;the Training Programme for Young Teachers in Universities of He‐nan Province,grant number 2020GGJS137;the Key Scientific Research Projects of Henan Province 22A413011;Henan Province Science and Technology R&D projects,grant number 202102210135,212102310547 and 212102210080;the National Nature Science Foundation of China,grant number U1813201.
CONFLICT OF INTEREST
The authors declare no conflict of interest.
DATA AVAILABILITY STATEMENT
The dataset established in this experiment is provided by Bearing Data Center in Case Western Reserve University.
ORCID
Haiquan Wanghttps://orcid.org/0000-0001-9480-0823
Wenxuan Yuehttps://orcid.org/0000-0002-8547-3792
Shengjun Wenhttps://orcid.org/0000-0002-6439-8375
Xiaobin Xuhttps://orcid.org/0000-0003-1822-6190
Hans‐Dietrich Haasishttps://orcid.org/0000-0003-3857-1
M0e4n7
ghao Suhttps://orcid.org/0000-0002-2688-5930
Ping liuhttps://orcid.org/0000-0002-8472-1563
Shanshan Zhanghttps://orcid.org/0000-0002-0385-5069
Panpan Duhttps://orcid.org/0000-0002-0539-3275
 CAAI Transactions on Intelligence Technology2022年4期
- CAAI Transactions on Intelligence Technology的其它文章
- CORRIGENDUM
- Guest Editorial:Special issue on recent developments in advanced mechatronics systems
- ST‐SIGMA:Spatio‐temporal semantics and interaction graph aggregation for multi‐agent perception and trajectory forecasting
- Construction of the rat brain spatial cell firing model on a quadruped robot
- Rethinking the image feature biases exhibited by deepconvolutional neural network models in image recognition
- Cross‐domain sequence labelling using language modelling and parameter generating