
Comparison of the SlTA Faster–a new visual field strategy with SlTA Fast strategy
2021-08-16 09:56:16ChaoXuQianQinChenQingCunYiJinTaoWenYanYangYueYangZhongYinHuYingTingZhuHuaZhong
Chao-Xu Qian, Qin Chen, Qing Cun, Yi-Jin Tao, Wen-Yan Yang, Yue Yang, Zhong-Yin Hu,Ying-Ting Zhu, Hua Zhong
1The First Αffiliated Hospital of Kunming Medical University,Kunming 650032, Yunnan Province, China
2The First Αffiliated Hospital of Nanjing Medical University,Nanjing 210000, Jiangsu Province, China
3Tissue Tech, Inc., 7300 Corporate Center Drive, Suite B,Miami, FL 33126, USA
Abstract
INTRODUCTION
Glaucoma is the leading cause of irreversible blindness worldwide[1-3]. Visual field (VF) evaluation, optic nerve head and retinal nerve fiber layer imaging are critical indicators used in the diagnosis and management of glaucoma[4].Perimetry is the most commonly used method for detecting patient’s VF or visual function. The first automated perimeter was invented in 1969, after then, it had developed into more comprehensive VF inspection methods. Full threshold automated VF examination had been the gold standard for the diagnosis and follow-up of glaucoma for several decades[5-7]. It provided an accurate assessment, but was time consuming[8-9].At that time, test duration usually exceeded 15min per eye[10-12].Prolonged test time may result in a great potential for visual fatigue, which may tend to decrease threshold values and may cause less reliable results[8,13-15]. This had even more obvious effect on glaucoma patients[11,15]. Besides fatigue, the long test duration also limited the possibility that VF tests could be performed more frequently. Although shorter tests were available, their reliability was reduced, which was a tradeoff between accuracy and efficiency[16]. Many new strategies have been developed for the purpose of reducing test duration and maintaining accuracy[17-19]. For example, the Swedish Interactive Thresholding Algorithm (SITA) strategies were developed in the late 1980s and become a very important tool to detect VF. SITA strategies, including SITA Standard(SS) and SITA Fast (SF), had been reported to be both fast and reliable[10-11]. The test duration of SF strategy was reduced by 70% when compared to the test duration of full threshold algorithms[10-11,20-21]. SF also had been proven to be highly sensitive, specific and reliable[18,22-23], which was used commonly by a majority of eye care professionals in many countries[24]. Therefore, using simple and rapid VF tests as a screening method become possible[25]. However, to monitor glaucoma efficiently, more frequent VF tests were needed to better observe the progression and to set up the treatment plans[26-27]. Recently, at least 3 tests per year for the first 2y after the diagnosis was required[27-28], and this was much more than the number of routine examinations in current clinical practice[29-30]. Thus, clinical practice strongly required a faster and accurate VF strategy. Therefore, researchers dedicated to find a more convenient device which had shorter test time and without losing of test quality. Recently, SITA Faster (SFer)was produced, which was developed for the purpose to replace SF[24]. Seven modifications were made to SF to produce SFer: 1) age-corrected initial stimulus intensities; 2) reducing reversals at primary test points; 3) using SF’s Prior model; 4)only one test at perimetrically blind points; 5) no false negative(FN) catch trails; 6) using gaze tracker; 7) eliminating the extra delay times[24]. Compared with SF, what were the advantages of SFer, and whether the results of the two strategies were interchangeable? However, as a newly developed VF test strategy, there were really few studies about the property of this strategy.
The purpose of this study was to evaluate this new time-saving threshold VF strategy, SFer, to compare its performance to SF strategy in four different groups, including the test duration and the agreement or differentiation between the two strategies.
SUBJECTS AND METHODS
Ethical ApprovalA retrospective observation study was conducted. The study proposal was approved by the Kunming Medical University Ethics Review Board. The research was conducted according to the tenets of the Declaration of Helsinki. Written informed consent was obtained from all participants.
SubjectsNinety-three participants (60 glaucoma patients and 33 normal volunteers) were enrolled in this study at the First Affiliated Hospital of Kunming Medical University. Normal was defined as having no ocular diseases, no other related field dysfunction. Diagnosis of glaucoma was based on the current glaucoma guidelines[4,27]. All subjects had refractive errors within ±8 D spherical equivalent and cylinder ≤3 D. Best‐corrected visual acuity ≥20/40.Patients with any other ocular diseases affecting the VF besides glaucoma were excluded from the study.
MethodsSF and SFer were all performed on the Humphrey 850 perimeter (Carl Zeiss Meditec, Inc, Dublin, CA, USA) in the 24-2 default mode. Both eyes were tested in random order,and one eye from each participant was chosen randomly for the study. All participants had previous experience with perimetry.SF tests were considered unreliable if the fixation losses, false positive (FP) and FN responses >25%. As there were only two reliability indices for the SFer, the FP catch trials and the gaze tracker, so we defined it was reliable for an SFer result if the FP rate ≤25% and >6° of eye movement ≤20% of the time[31]. Patients had a short break of at least 15min between the two tests. In order to further analyze the differences among differing stages of glaucoma, and show some differences from the study of Heijlet al[24], patients were classified into 3 groups based on mean deviation (MD) from SF, as per the methods of Gazzardet al[32]. Mild glaucoma, defined as MD≥‐10 dB(n=29); moderate glaucoma, MD less than -10 dB but more than or equal to -20 dB (n=17); and severe glaucoma, MD≤‐20 dB(n=14).
Statistical AnalysisStatistical analyses were done using SPSS 22.0 (Armonk, NY, USA) and MedCalc 18 (Acacialaan,Ostend, Belgium). The differences of test times, MD, the numbers of depressed test points at the significant levels ofP?5%, ?2%, ?1%, and ?0.5% in the total deviation (TD)and the pattern deviation (PD) probability plots between the two strategies were compared with analysis of variance(ANOVA) and Student’st-test. The agreement of the MD and VFI between the two strategies was analyzed through Bland-Altman plots. The correlation between the two strategies for MD and visual field index (VFI) was analyzed using nonparametric Spearman correlation method. The differences of FP values between the two strategies were analyzed through nonparametric Wilcoxon signed rank test. The statistically significant level was set at theP?0.05.
RESULTS
Of the 93 participants, 34 were men (37%) and 59 were women. The mean age of the subjects was 48.6±20.0y (range,13-84y). VF were successfully measured using the SF and SFer strategies.
The number of participants who had PF response for SF and SFer was 37/93 and 35/93. The median value was 3% for SF and 4% for SFer. There was no significant difference in PF between the two strategies for all the participants (P=0.618)and for each subgroup (mild group:P=0.425; moderate group:P=0.058; severe group:P=0.064; normal group:P=0.174).
A summary of the overall test times of each group were provided in Table 1. The mean durations of glaucoma patients for SF were 264.9±64.5s, for SFer were 177.4±44.2s, about 33% shorter. When the pairwise comparisons were performed for the 4 groups, the test durations of the two strategies were statistically different (P<0.001). Scatter plot of test durations for both strategies were showed in Figure 1, showing that SFerhad significant shorter test durations than SF. Test durations were obviously dependent on the severity of the VF defects.The shortest test durations were found in normal group.However, the biggest duration improvement between the two strategies was in the severe glaucoma group, followed by in mild glaucoma group and moderate glaucoma group.
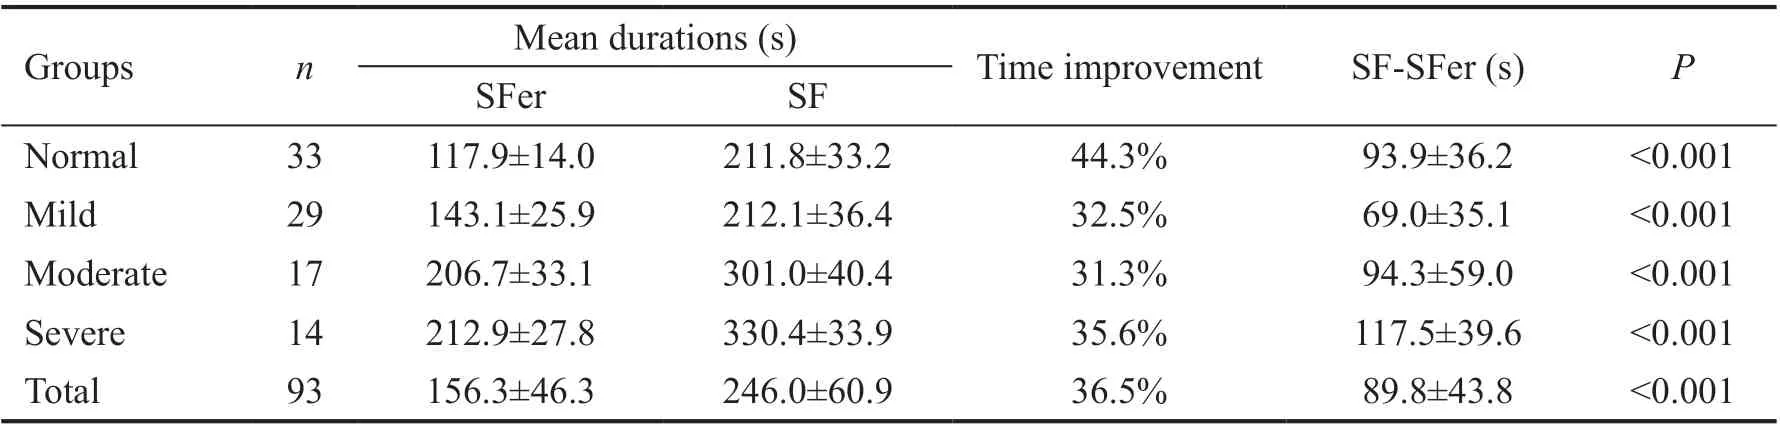
Table 1 Test durations of different groups for SITA Faster and SITA Fast mean±SD

Table 2 MD of different groups for SITA Faster and SITA Fast mean±SD
MD values were similar in each group between the two strategies.The median MD values were -4.55 dB for SFer, -4.47 dB for SF.Differences between the strategies and subgroups were showed in Table 2. The MD values of SFer were slightly bigger than those of SF in each group, however, there were no statistically significant differences between the two strategies.
The numbers of depressed points at the significant levels ofP?5%, ?2%, ?1%, and ?0.5% in TD and PD probability plots for each group were listed in Table 3. There was no statistically significant difference between the numbers of depressed points at any of the probability plots.
In Figure 2, Bland-Altman plots of MD and VFI illustrated the agreement between strategies. For MD, there was a mean difference of -0.3 dB (MDSFer–MDSF). For VFI, there was a mean difference of 0.0 (VFISFer–VFISF). The analysis suggested good agreement between the two strategies.
Correlation between SFer and SF was showed in Figure 3.There was a high correlation for MD (r=0.986,P<0.001) and VFI (r=0.986,P<0.001) between the two strategies.
DISCUSSION
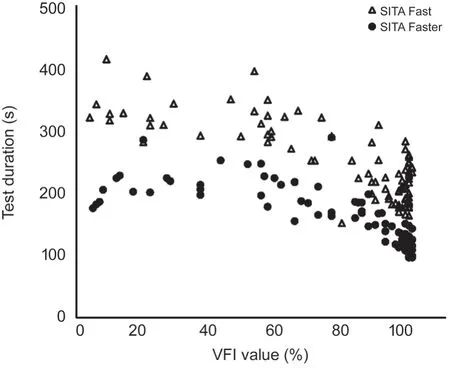
Figure 1 Scatter plot of test durations in different stages of glaucoma SITΑ Faster had significant shorter test durations than SITΑ Fast. The shortest test durations were in normal group. The biggest time improvement between the two strategies was in the severe glaucoma group. SITA Fast: R2=0.632, 95%CL, 248.23, 281.54; SITA Faster: R2=0.588, 95%CL, 166.01, 188.82. VFI: Visual field index.
The present study aimed at the performance of two VF strategies, SF and SFer. As a new strategy, the foremost advantage of SFer is obviously the shorter test duration.According to our study, the mean test durations for SFer strategy was 156.3±46.3s, which was 36.5% shorter compared to 246.0±60.9s for the SF strategy (Table 1). The results were similar to the previous study which had reported the test duration was 30.4% shorter when compared SFer to SF[24]. In the present study, each group had a significant improvement using SFer strategy. The biggest duration improvement between the two strategies was in the severe glaucoma group,suggesting that patients with severe glaucoma might be the best subjects to use SFer strategy for time saving benefits in clinical practice. Test durations were obviously related to the stage of glaucoma for both strategies (Figure 1). Test durations in eyes with severe glaucoma were about twice to those in the normal eyes and about half more than those in the mild stage eyes.Test durations were obviously dependent on the severity of the VF defects. The shortest test duration was found in normal group. Obviously, shorter test duration could increase testing efficiency and reduce visual fatigue. Statistically significant perimetric fatigue affected manifest in VF examinations[33-34].In addition, based on feedbacks from participants after the test,the shorter test duration makes the task of completing a VF test a better experience. Compared with SF, SFer was more convenience and more acceptable.
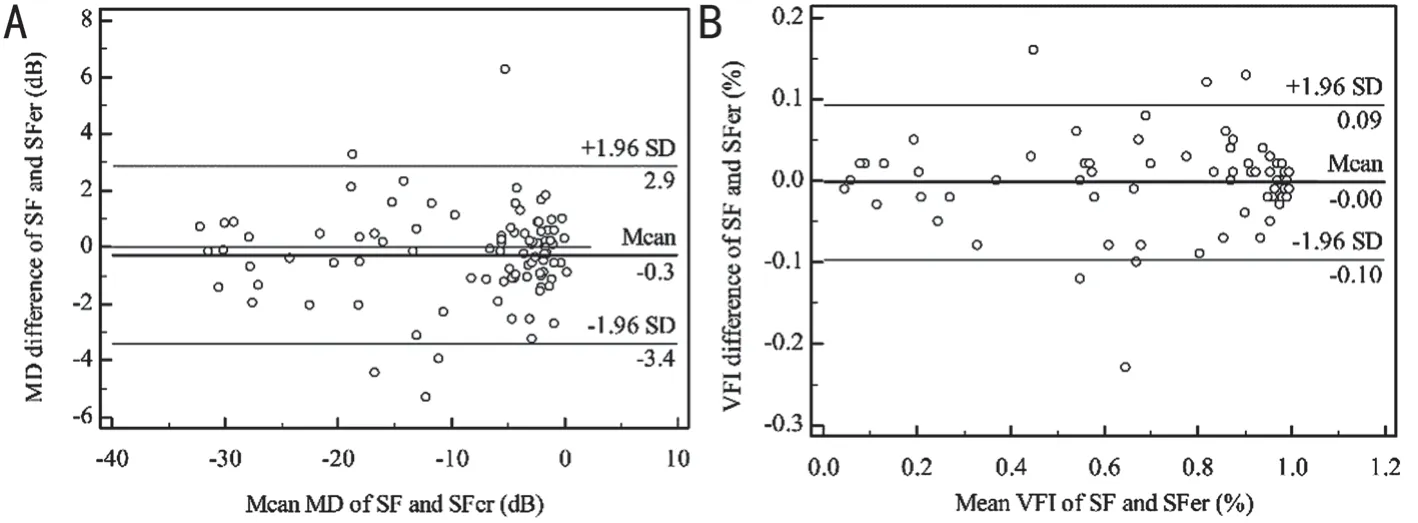
Figure 2 Bland-Altman plots of MD and VFI between SITA Faster and SITA Fast Bland-Altman scatter plot showed a great agreement between SITΑ Faster and SITΑ Fast. Α: Bland‐Αltman plot of the difference in MD values. B: Bland‐Αltman plot of the difference in VFI values.The solid lines marked the mean differences, and the dash lines showed the 95% confidence intervals. MD: Mean deviation; VFI: Visual field index; SF: SITA Fast; SFer: SITA Faster.

Figure 3 Correlations of MD and VFI between SITA Faster and SITA Fast Significant positive correlations were noted between the two strategies. Α: Significant positive correlations in MD values between the two strategies (r=0.986, P?0.001). B: Significant positive correlations in VFI values between the two strategies (r=0.986, P<0.001). MD: Mean deviation; VFI: Visual field index; SF: SITΑ Fast; SFer: SITΑ Faster.
In our study, we analyzed the number of PF responses for both strategies and for subgroups. The difference between the two strategies was not statistically significant for normal group (P=0.174) and for glaucoma groups (P=0.667). From this point of view, it seems a similar reliability between the two strategies. However, the percentage of FP for SFer (0-21%) were a little higher than SF (0-13%). This may be caused by that the initial stimulating intensity were age-corrected,similar to the difference between SF and SS, resulting in more uncertainty[35-36].
The MD represented sensitivity of global VF reduction. The difference of mean MD in total subjects was 0.27±1.6 dB(Table 2). SFer showed very similar mean MD values in each group when compared with those of SF. The MD comparison results indicated that there was no statistically significant difference between the two strategies (P>0.1), which was similar to study of Heijlet al[24]. The average values of “SFer-SF” in each group were insignificant and within the 1.0 dB equivalence limit range. The absolute MD values of SFer were slightly smaller than SF, suggesting a shallower field defect. Probably these modifications could explain the small differences of MD between the two strategies. Heijlet al[37]concluded in another study that these differences may be due to reduced visual fatigue and greater patient alertness. It had also been reported that differences in average threshold value were strongly associated with differences in test time[18]. Though this was statistically insignificant (P>0.1), but clinicians should still notice that results between the two strategies might be not directly interchangeable, for the results of SFer maybe underestimate the severity of glaucoma.
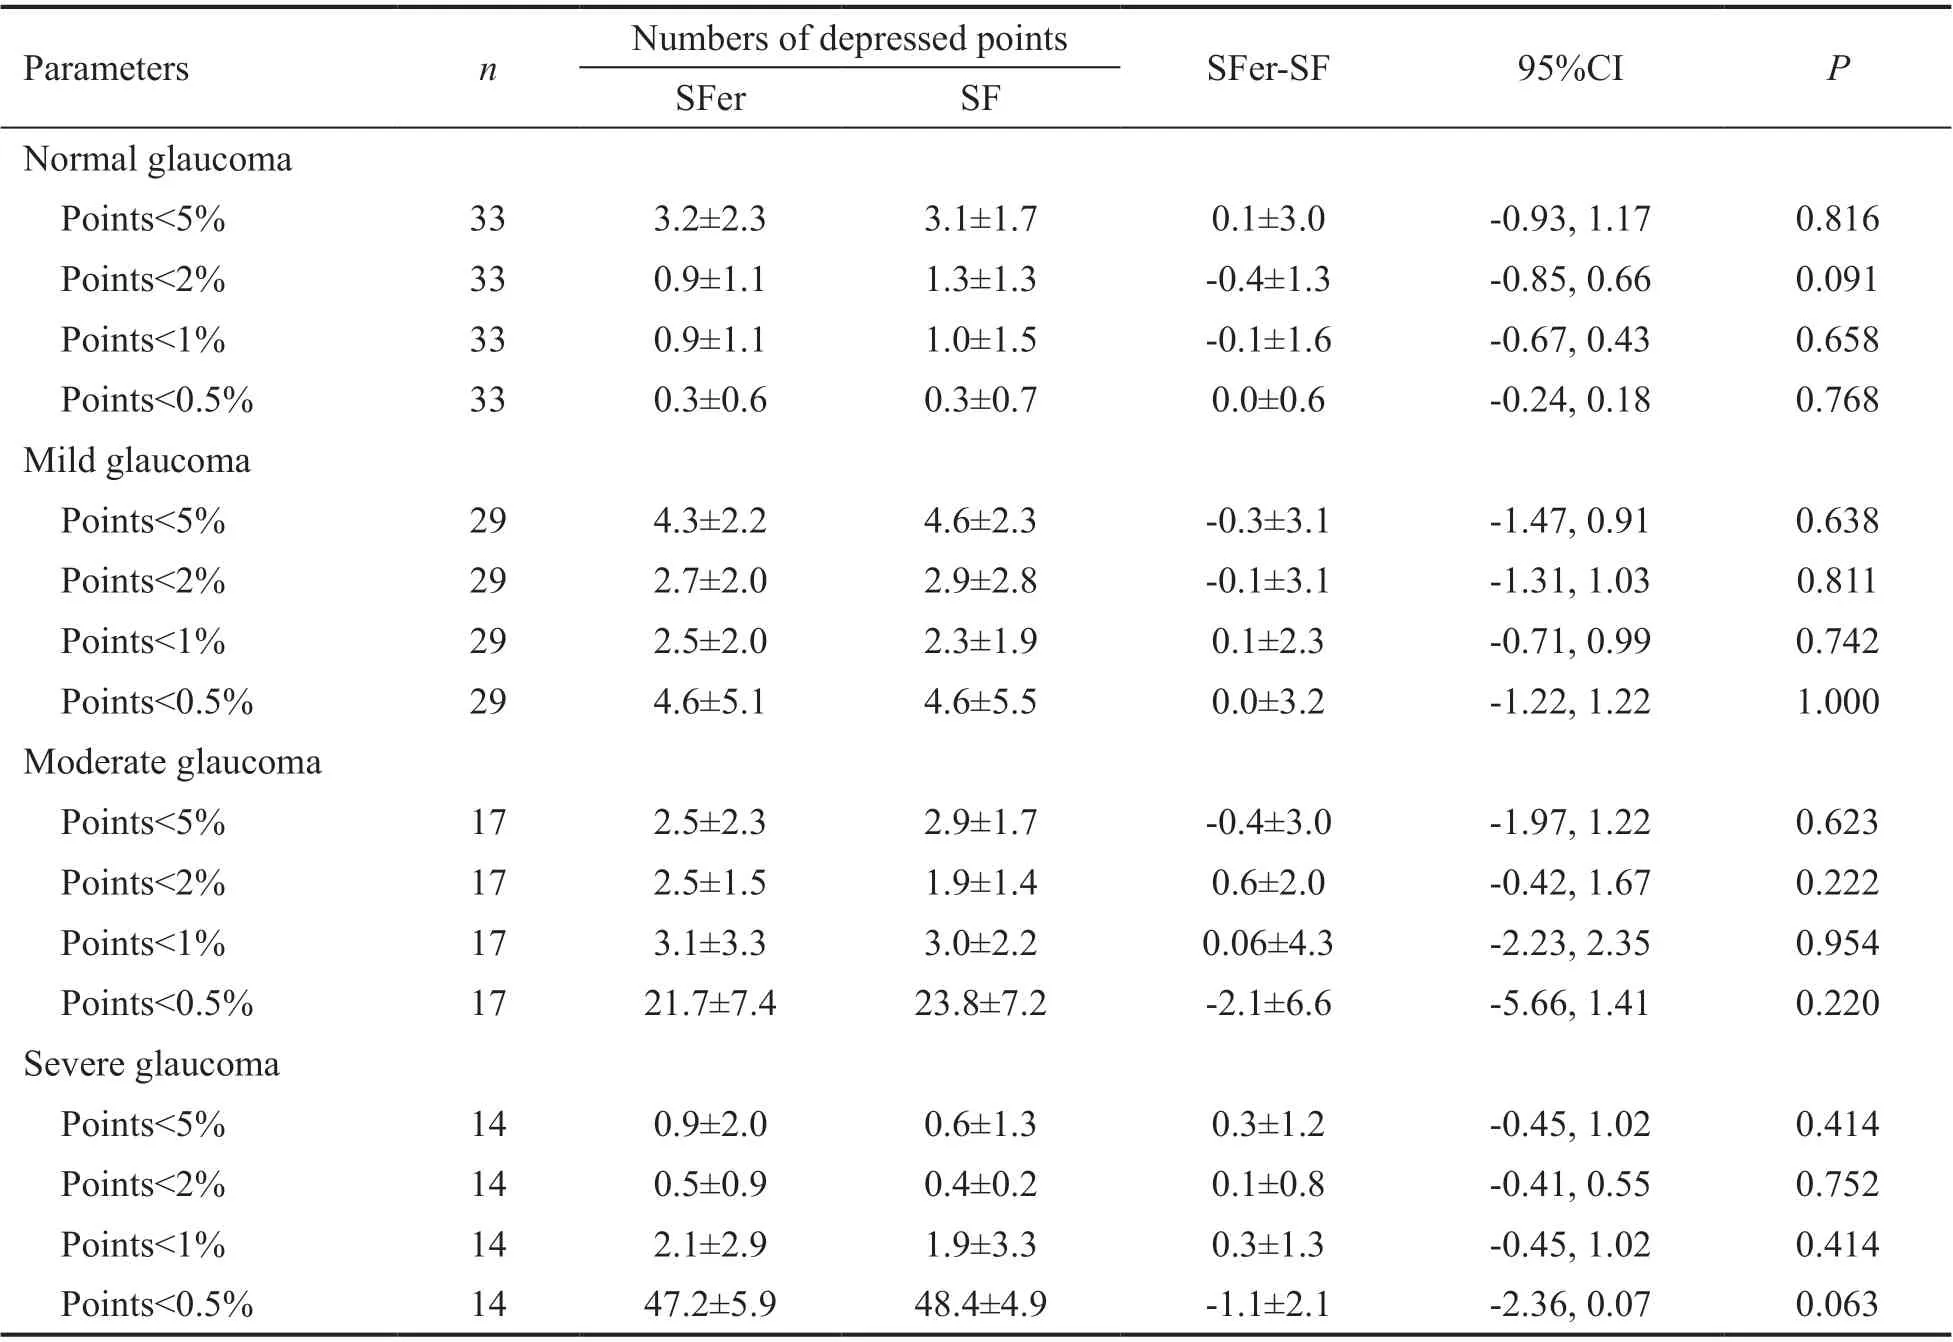
Table 3 The numbers of depressed test points at the significant levels of P?5%, ?2%, ?1%, and ?0.5% in pattern deviation probability plots for SITA Faster and SITA Fast mean±SD
As MD and VFI were global parameters for reduction in VF.The increased of MD and VFI values demonstrated a nonspecific loss of sensitivity. By applying Bland-Altman test,we found a good agreement between the SF and the SFer(Figure 2). We analyzed the MD and VFI of the two strategies and found that the inter-strategies tests were comparable.The differences in the average of parameters between the measurements were statistically insignificant. The results were similar to study of Heijlet al[24].
The correlation relationships for MD and VFI between the two strategies were analyzed (Figure 3). There was a highly significant correction between the two strategies for either MD or VFI. While compared the different stages of glaucoma, only the moderate glaucoma group had a slight difference, with no statistical significance. Therefore, in our study, for assessing global VF sensitivity loss, SFer had a great test quality compared with SF.
Additional evidence for agreement between SF and SFer showed the similarity of numbers of depressed points in the TD and PD probability plots. As shown in Table 3, the numbers of depressed test points at the significant levels ofP?5%, ?2%,?1%, and ?0.5% in each group had no statistically significant differences (P>0.05). These indices were focal parameters for reduction in VF. The highly agreement results demonstrated that both strategies may be similar for determination of focal VF sensitivity loss.
There were some limitations which merit mentioning here.In this study, we compared SFer with SF strategy, not with SS. Now, SS has remained the most commonly used strategy and the glaucoma specialist community cares more about the comparison between SFer and SS. Any new technology should be compared to the standard. Practice needs to be supported by evidence and that is the question to be addressed and where data is needed. In our further study, the comparison between SFer, SF, and SS will be performed.
In conclusion, probably SF strategy was not an ideal gold standard to compare to, but its properties had been thoroughly investigated and SFer was design from SF. So according to our study, SFer showed very similar results in the number of FP responses, MD, VFI, and numbers of depressed points at any significant levels both in normal and glaucoma subjects when compared to SF. There was a great agreement between the VF data from SF and SFer. The test duration of SFer was 36.5% shorter than SF. Shorter testing times made the progress of VF test more convenient and could increase the frequency of test, which provided great assistance for detecting earlier of glaucoma and for assessing the rate of progression. As the screening methods should be rapid, inexpensive, convenient,and highly sensitive[38], this new time-saving strategy may provide an ideal method for VF testing in patients with glaucoma, in subjects requiring screening, and may provide the optimal choice for disease follow-up. However, we should note that the visual field deficits of SFer were slightly smaller than those of SF. Therefore, the two strategies might be not directly interchangeable.
ACKNOWLEDGEMENTS
Conflicts of Interest: Qian CX,None;Chen Q,None;Cun Q,None;Tao YJ,None;Yang WY,None;Yang Y,None;Hu ZY,None;Zhu YT,None;Zhong H,None.
 International Journal of Ophthalmology2021年8期
- International Journal of Ophthalmology的其它文章
- Macular density alterations in myopic choroidal neovascularization and the effect of anti-VEGF on it
- Mid-term results of patterned laser trabeculoplasty for uncontrolled ocular hypertension and primary open angle glaucoma
- Combined ab-interno trabeculectomy and cataract surgery induces comparable intraocular pressure reduction in supine and sitting positions
- Evaluating newer generation intraocular lens calculation formulas in manual versus femtosecond laser-assisted cataract surgery
- Conjunctival flap with auricular cartilage grafting: a modified Hughes procedure for large full thickness upper and lower eyelid defect reconstruction
- Improvement of human embryonic stem cell-derived retinal pigment epithelium cell adhesion, maturation, and function through coating with truncated recombinant human vitronectin