
China Nonferrous Metals Association Plans to Start Works Relevant to Carbon Emission Right Transaction
2021-08-13 05:20:32
China Nonferrous Metals Monthly 2021年7期
China Nonferrous Metals Association Plans to Start Works Relevant to Carbon Emission Right Transaction
For the purpose of implementing initiatives deployed by our nation in carbon emission peak and carbon neutral, promoting the construction of national carbon emission right transaction (shortened as “national carbon market” below), and giving full play to industrial associations’ roles in industry management, industry self-discipline and professional service, Climate Division of Ministry of Ecological Environment has sent letter of entrustment to China Nonferrous Metals Association to officially entrust China Nonferrous Metals Association with carrying out works relevant to construction of national carbon market in nonferrous market.
Letter of entrustment mainly involves 5 aspects: preparing and updating allocation plans of aluminum carbon quota; testing-related work for supporting system of national carbon market in nonferrous industry; investigation related to system of carbon emission monitoring, report and examination in nonferrous market; performing organizational coordinating role to promptly collect and reflect problems and advise on solutions; utilizing strengths of professional teams and talents and combining industrial demands to support basic capacity building for national carbon market.
For the purpose of advancing related works of constructing national carbon market, Nonferrous Association will further follow specific requirements explicated in letter of entrustment from Division of Ministry of Ecological Environment to lead the industry and companies to provide competent department and companies with consulting and diagnostic service in aluminum quota allocation plans and reference value measuring, operational testing solutions research and formulating for national carbon market, system of data investigation, analysis, monitoring and examination of carbon emission in nonferrous industry. Meanwhile, Nonferrous Association will actively organize and facilitate training programs on carbon emission administrators, devote itself to details centering on constructing national carbon market and advance all services phase by phase. The Association will also make efforts to motivate companies to actively and creatively reduce pollutions and carbon to improve their carbon trading ability and carbon emission management ability.
Unit: metric ton
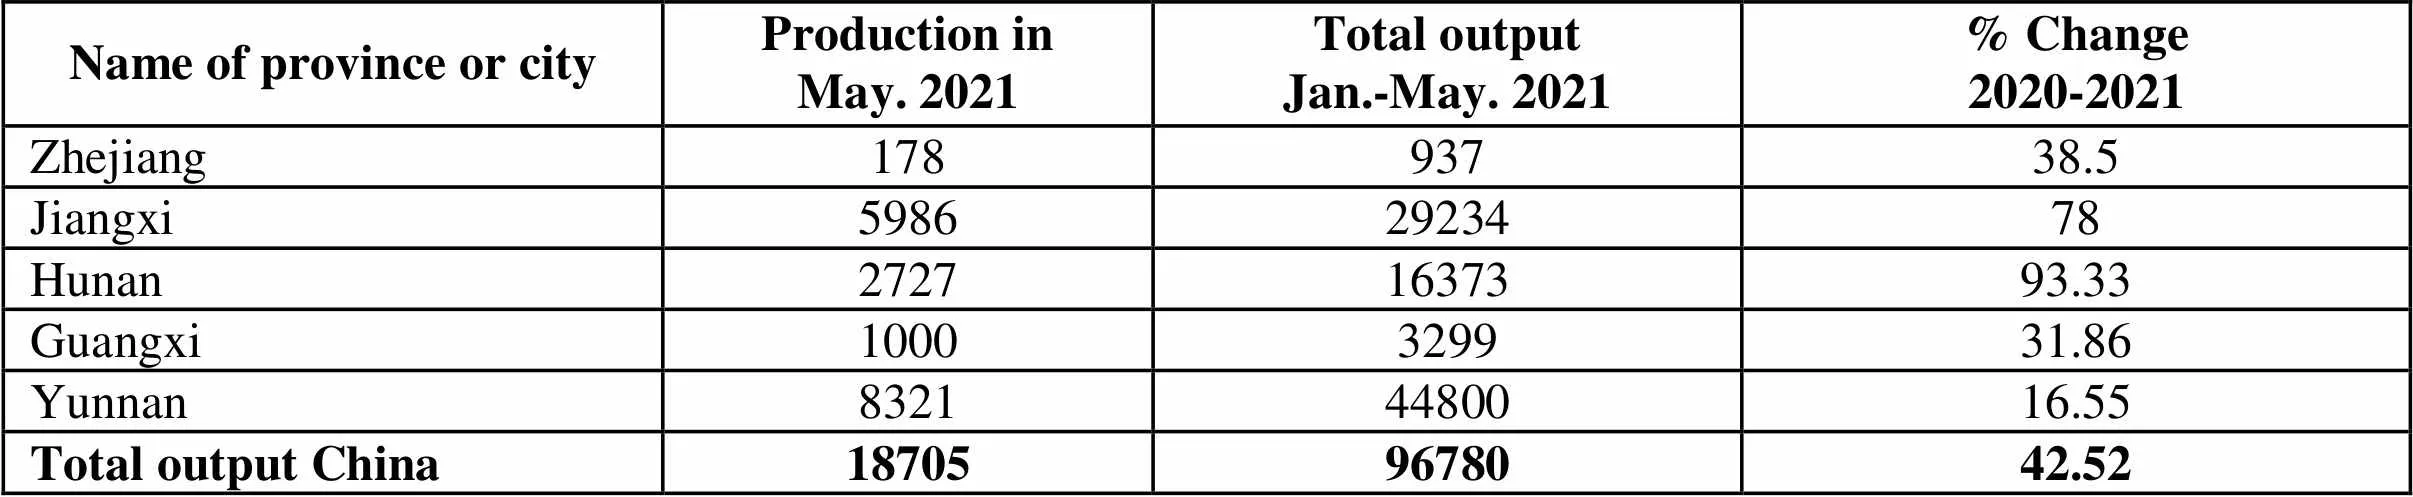
Name of province or cityProduction inMay. 2021Total outputJan.-May. 2021% Change2020-2021 Zhejiang17893738.5 Jiangxi59862923478 Hunan27271637393.33 Guangxi1000329931.86 Yunnan83214480016.55 Total output China187059678042.52
Unit: metric ton
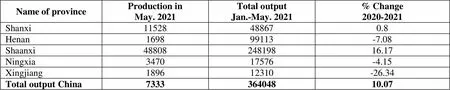
Name of provinceProduction inMay. 2021Total outputJan.-May. 2021% Change2020-2021 Shanxi11528488670.8 Henan169899113-7.08 Shaanxi4880824819816.17 Ningxia347017576-4.15 Xingjiang189612310-26.34 Total output China733336404810.07
Unit: metric ton
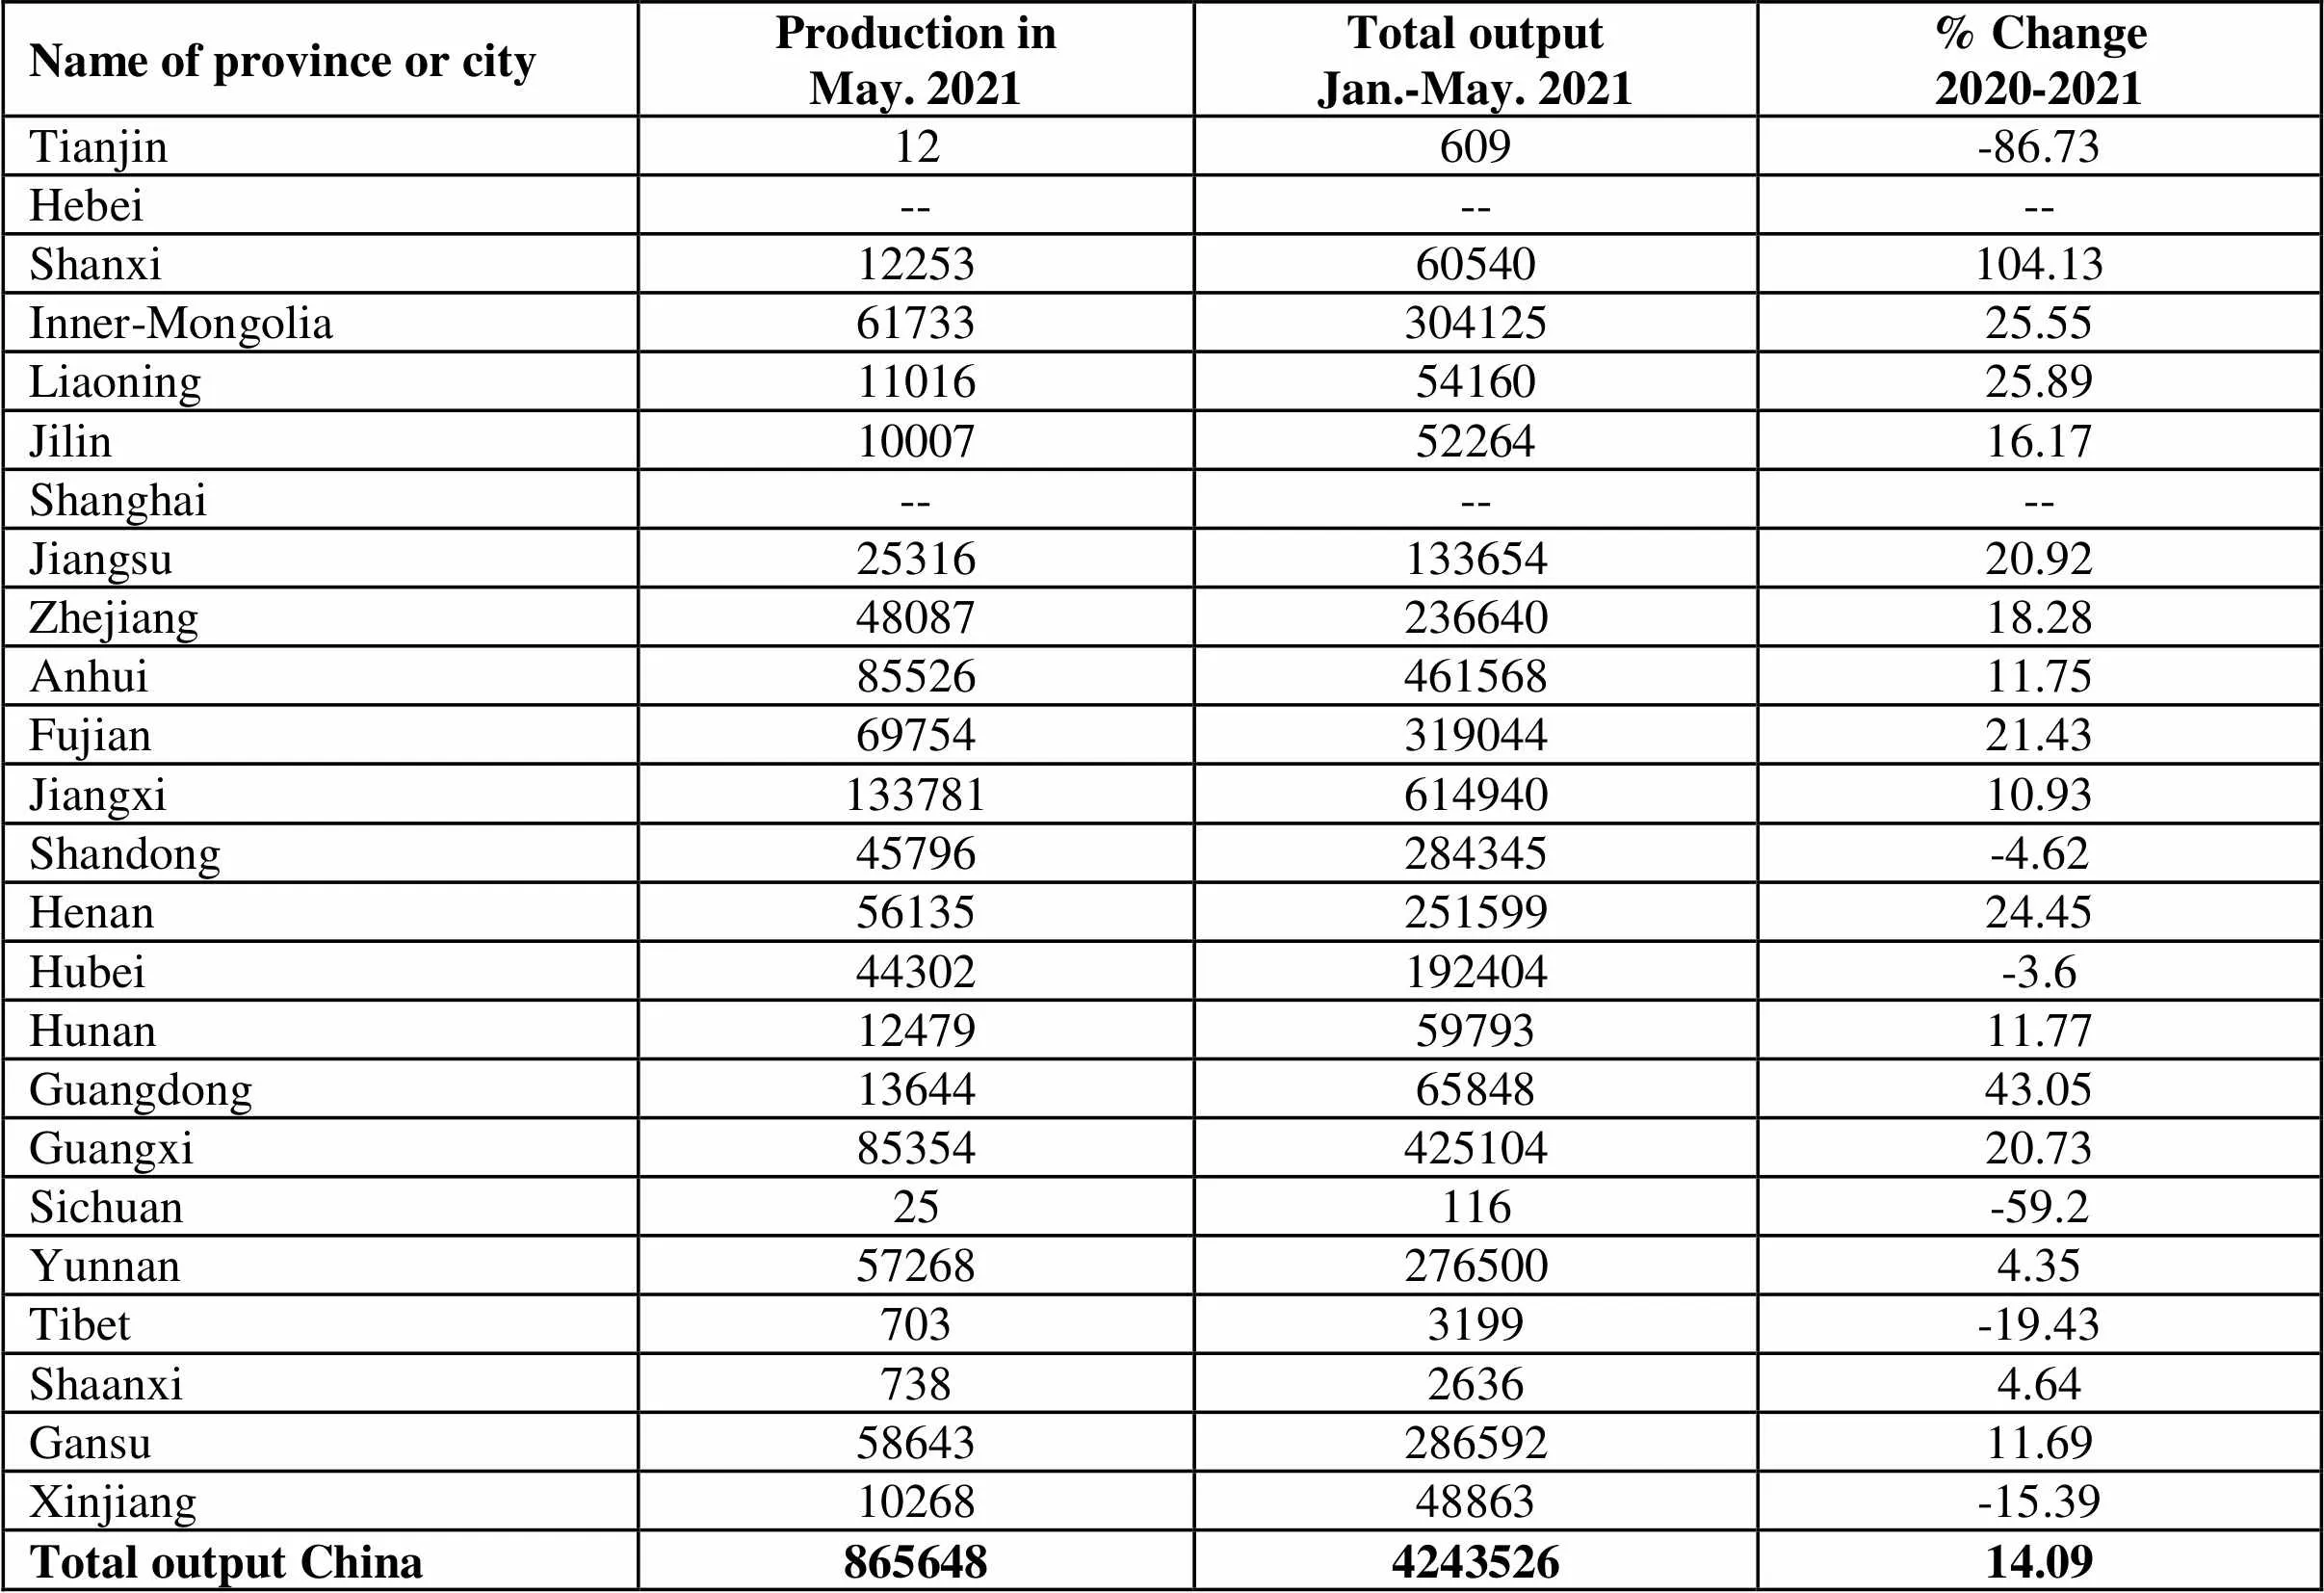
Name of province or cityProduction inMay. 2021Total outputJan.-May. 2021% Change2020-2021 Tianjin12609-86.73 Hebei------ Shanxi1225360540104.13 Inner-Mongolia6173330412525.55 Liaoning110165416025.89 Jilin100075226416.17 Shanghai------ Jiangsu2531613365420.92 Zhejiang4808723664018.28 Anhui8552646156811.75 Fujian6975431904421.43 Jiangxi13378161494010.93 Shandong45796284345-4.62 Henan5613525159924.45 Hubei44302192404-3.6 Hunan124795979311.77 Guangdong136446584843.05 Guangxi8535442510420.73 Sichuan25116-59.2 Yunnan572682765004.35 Tibet7033199-19.43 Shaanxi73826364.64 Gansu5864328659211.69 Xinjiang1026848863-15.39 Total output China865648424352614.09
Unit: metric ton
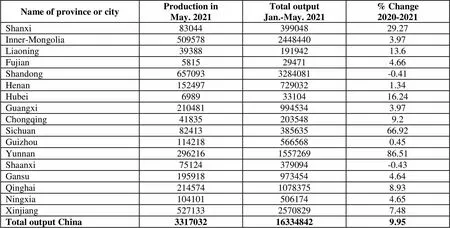
Name of province or cityProduction inMay. 2021Total outputJan.-May. 2021% Change2020-2021 Shanxi8304439904829.27 Inner-Mongolia50957824484403.97 Liaoning3938819194213.6 Fujian5815294714.66 Shandong6570933284081-0.41 Henan1524977290321.34 Hubei69893310416.24 Guangxi2104819945343.97 Chongqing418352035489.2 Sichuan8241338563566.92 Guizhou1142185665680.45 Yunnan296216155726986.51 Shaanxi75124379094-0.43 Gansu1959189734544.64 Qinghai21457410783758.93 Ningxia1041015061744.65 Xinjiang52713325708297.48 Total output China3317032163348429.95
Unit: metric ton
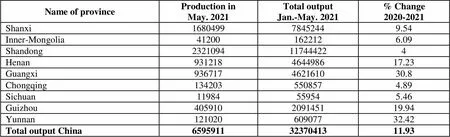
Name of province Production inMay. 2021Total outputJan.-May. 2021% Change2020-2021 Shanxi168049978452449.54 Inner-Mongolia412001622126.09 Shandong2321094117444224 Henan931218464498617.23 Guangxi936717462161030.8 Chongqing1342035508574.89 Sichuan11984559545.46 Guizhou405910209145119.94 Yunnan12102060907732.42 Total output China65959113237041311.93
Unit: metric ton
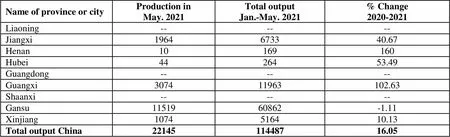
Name of province or cityProduction inMay. 2021Total outputJan.-May. 2021% Change2020-2021 Liaoning------ Jiangxi1964673340.67 Henan10169160 Hubei4426453.49 Guangdong------ Guangxi307411963102.63 Shaanxi------ Gansu1151960862-1.11 Xinjiang1074516410.13 Total output China2214511448716.05
Unit: metric ton
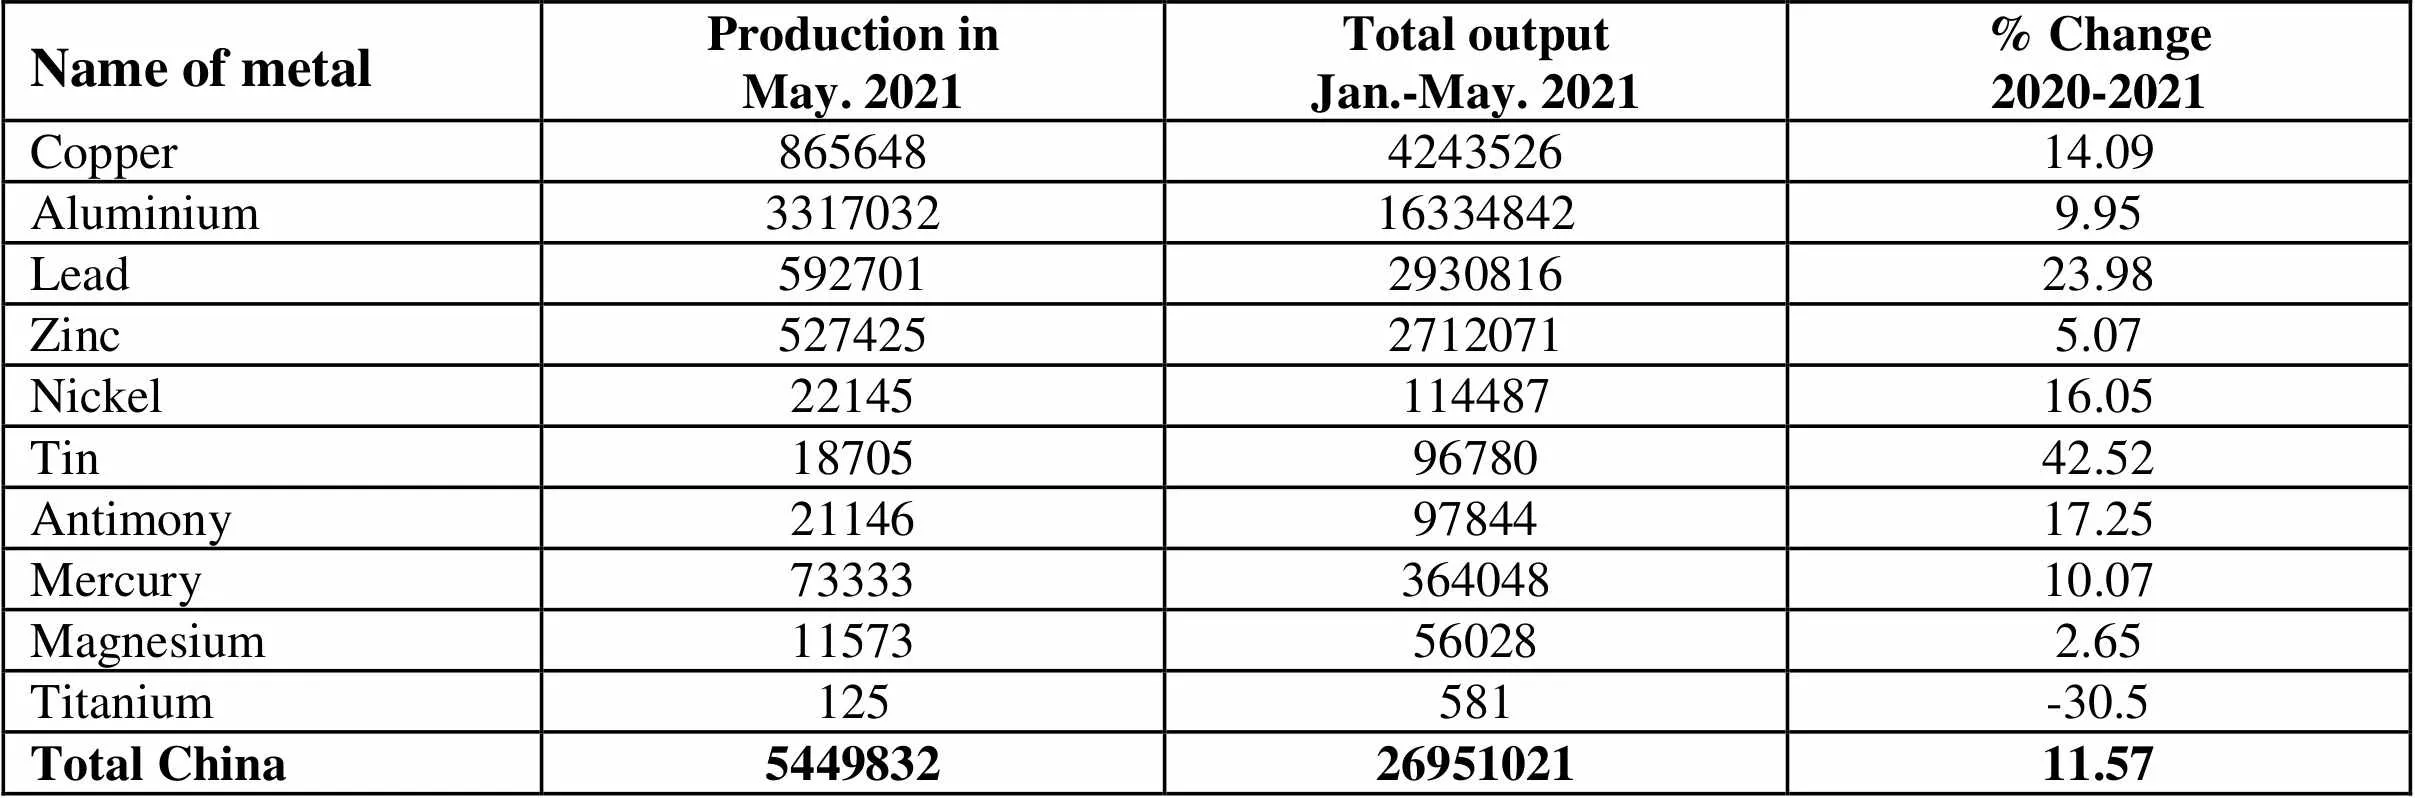
Name of metalProduction inMay. 2021Total outputJan.-May. 2021% Change2020-2021 Copper865648424352614.09 Aluminium3317032163348429.95 Lead592701293081623.98 Zinc52742527120715.07 Nickel2214511448716.05 Tin187059678042.52 Antimony211469784417.25 Mercury7333336404810.07 Magnesium11573560282.65 Titanium125581-30.5 Total China54498322695102111.57
Unit: metric ton
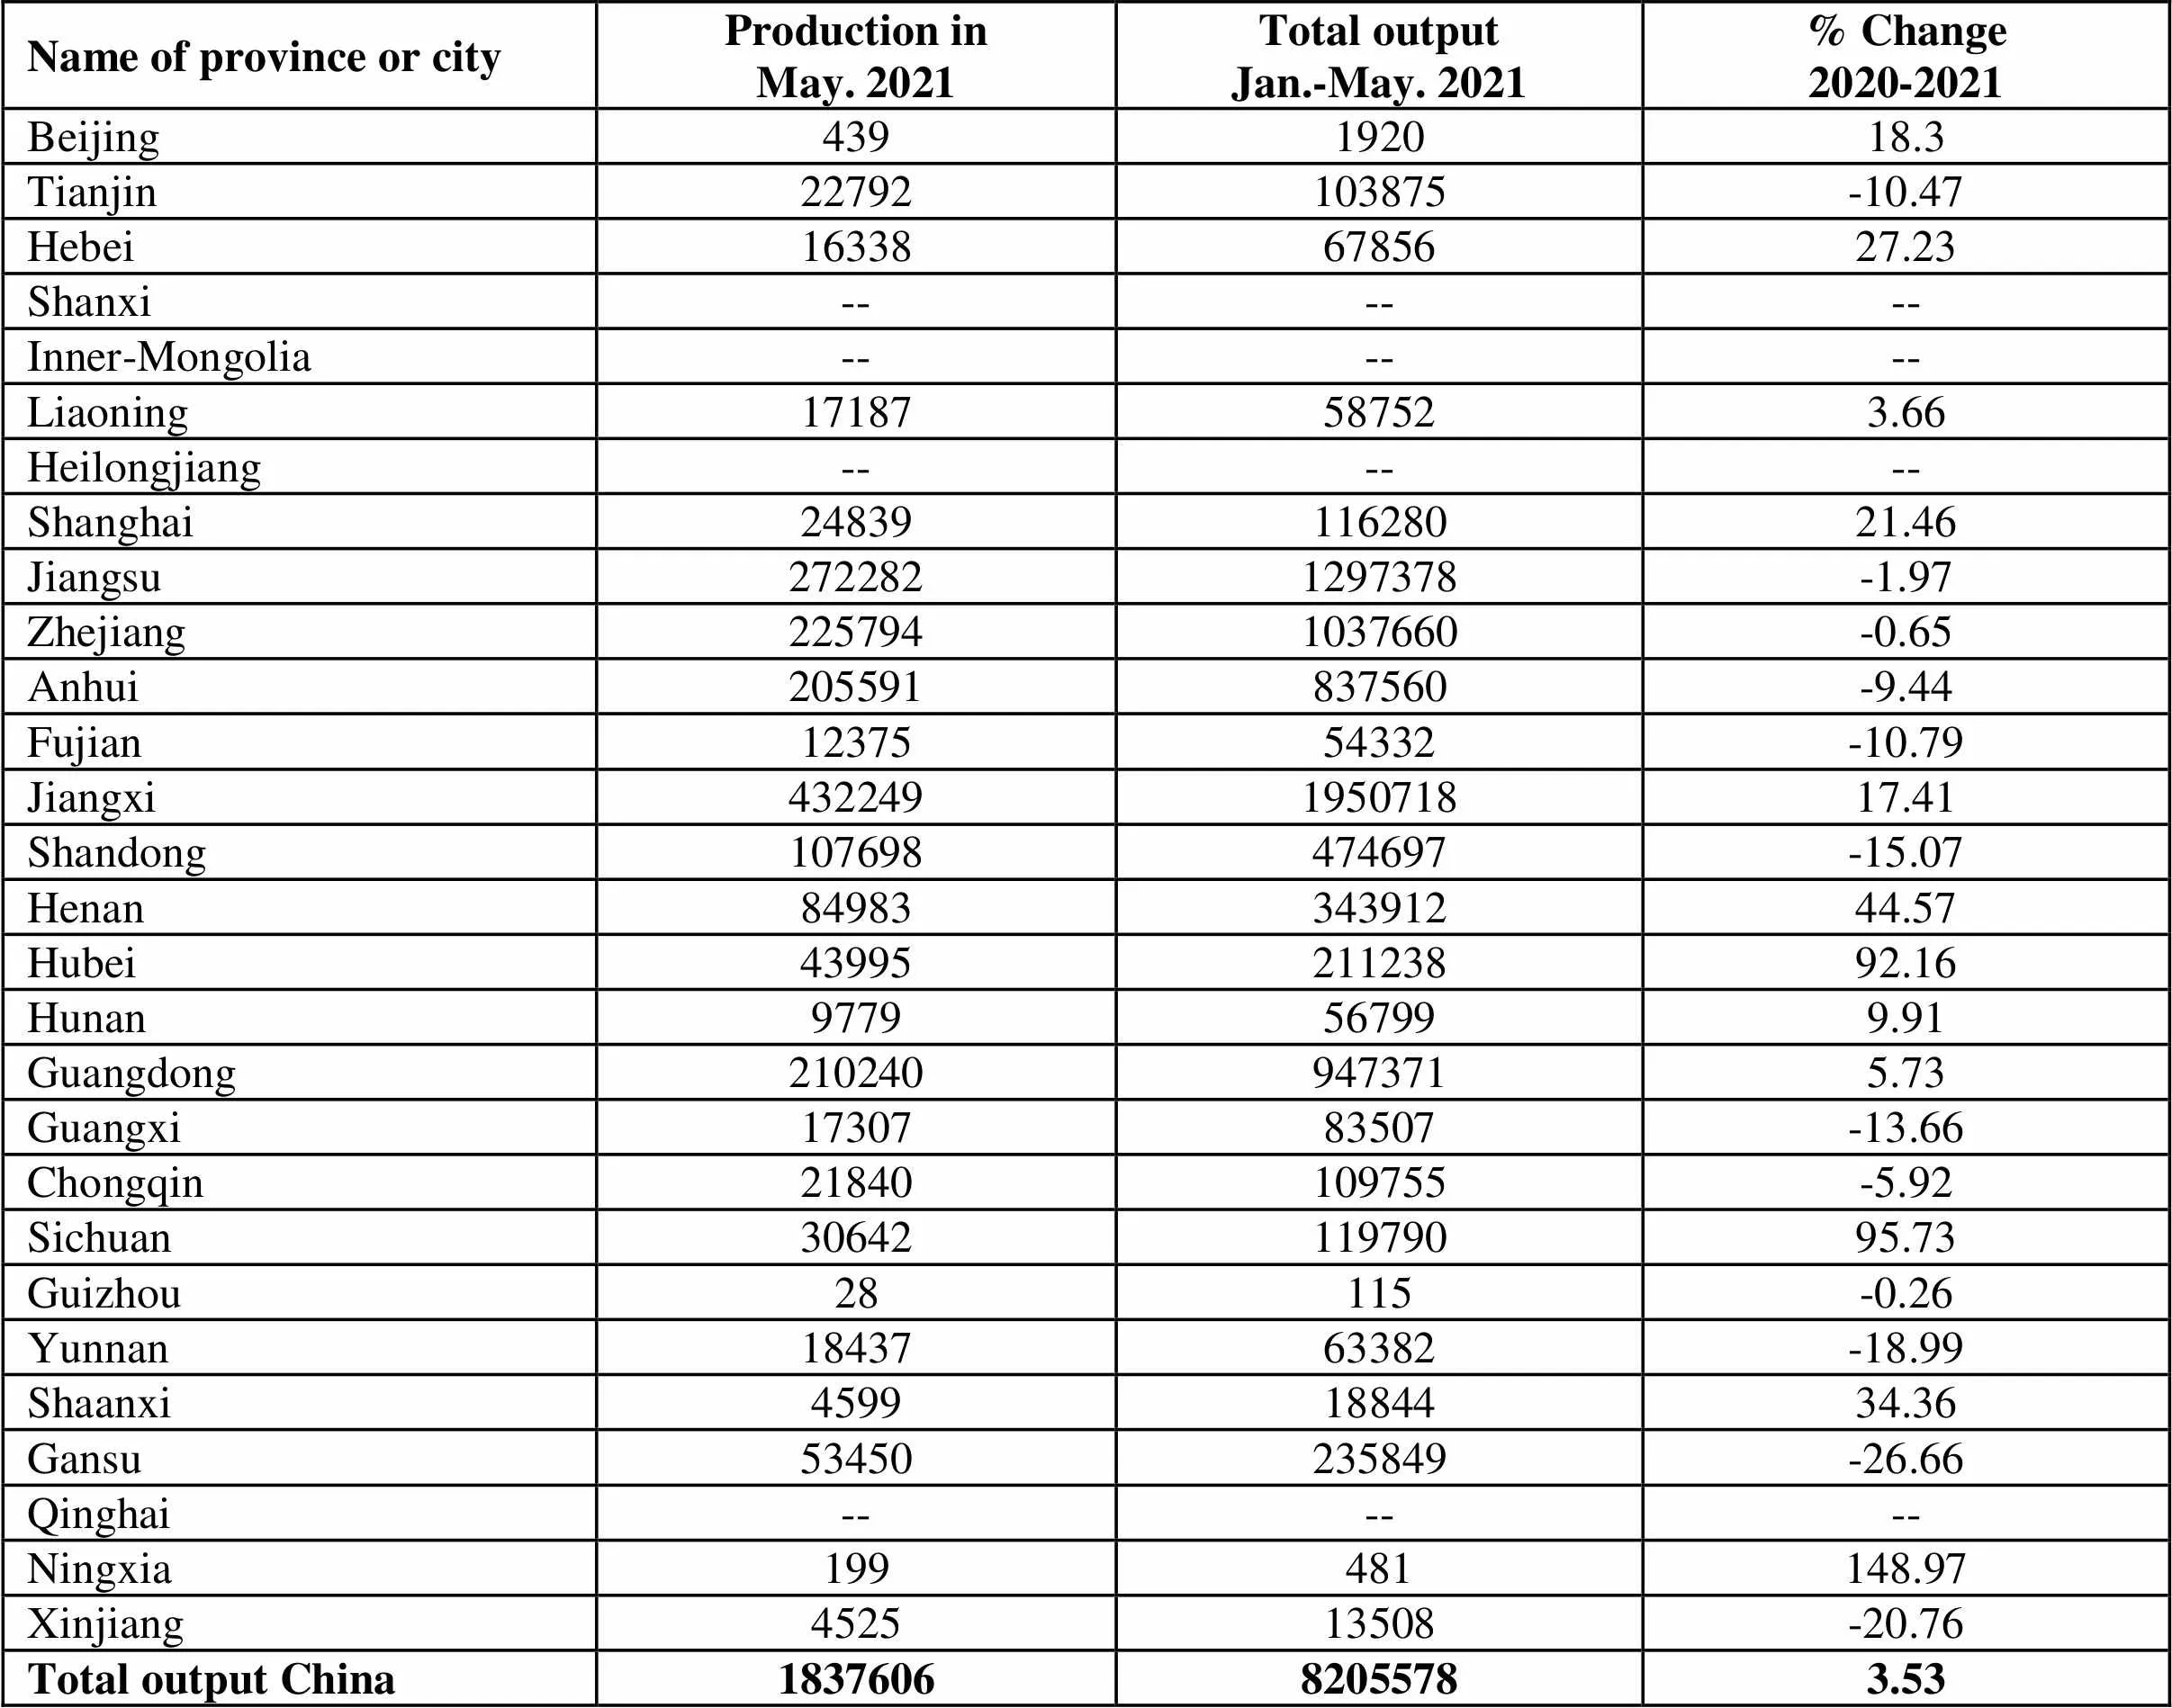
Name of province or cityProduction inMay. 2021Total outputJan.-May. 2021% Change2020-2021 Beijing439192018.3 Tianjin22792103875-10.47 Hebei163386785627.23 Shanxi------ Inner-Mongolia------ Liaoning17187587523.66 Heilongjiang------ Shanghai2483911628021.46 Jiangsu2722821297378-1.97 Zhejiang2257941037660-0.65 Anhui205591837560-9.44 Fujian1237554332-10.79 Jiangxi432249195071817.41 Shandong107698474697-15.07 Henan8498334391244.57 Hubei4399521123892.16 Hunan9779567999.91 Guangdong2102409473715.73 Guangxi1730783507-13.66 Chongqin21840109755-5.92 Sichuan3064211979095.73 Guizhou28115-0.26 Yunnan1843763382-18.99 Shaanxi45991884434.36 Gansu53450235849-26.66 Qinghai------ Ningxia199481148.97 Xinjiang452513508-20.76 Total output China183760682055783.53
Unit: metric ton
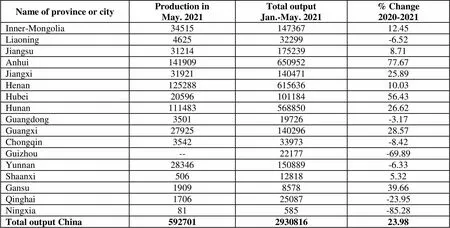
Name of province or cityProduction inMay. 2021Total outputJan.-May. 2021% Change2020-2021 Inner-Mongolia 3451514736712.45 Liaoning462532299-6.52 Jiangsu312141752398.71 Anhui14190965095277.67 Jiangxi3192114047125.89 Henan12528861563610.03 Hubei2059610118456.43 Hunan11148356885026.62 Guangdong350119726-3.17 Guangxi2792514029628.57 Chongqin354233973-8.42 Guizhou--22177-69.89 Yunnan28346150889-6.33 Shaanxi506128185.32 Gansu1909857839.66 Qinghai170625087-23.95 Ningxia81585-85.28 Total output China592701293081623.98
Unit: metric ton(metal content)
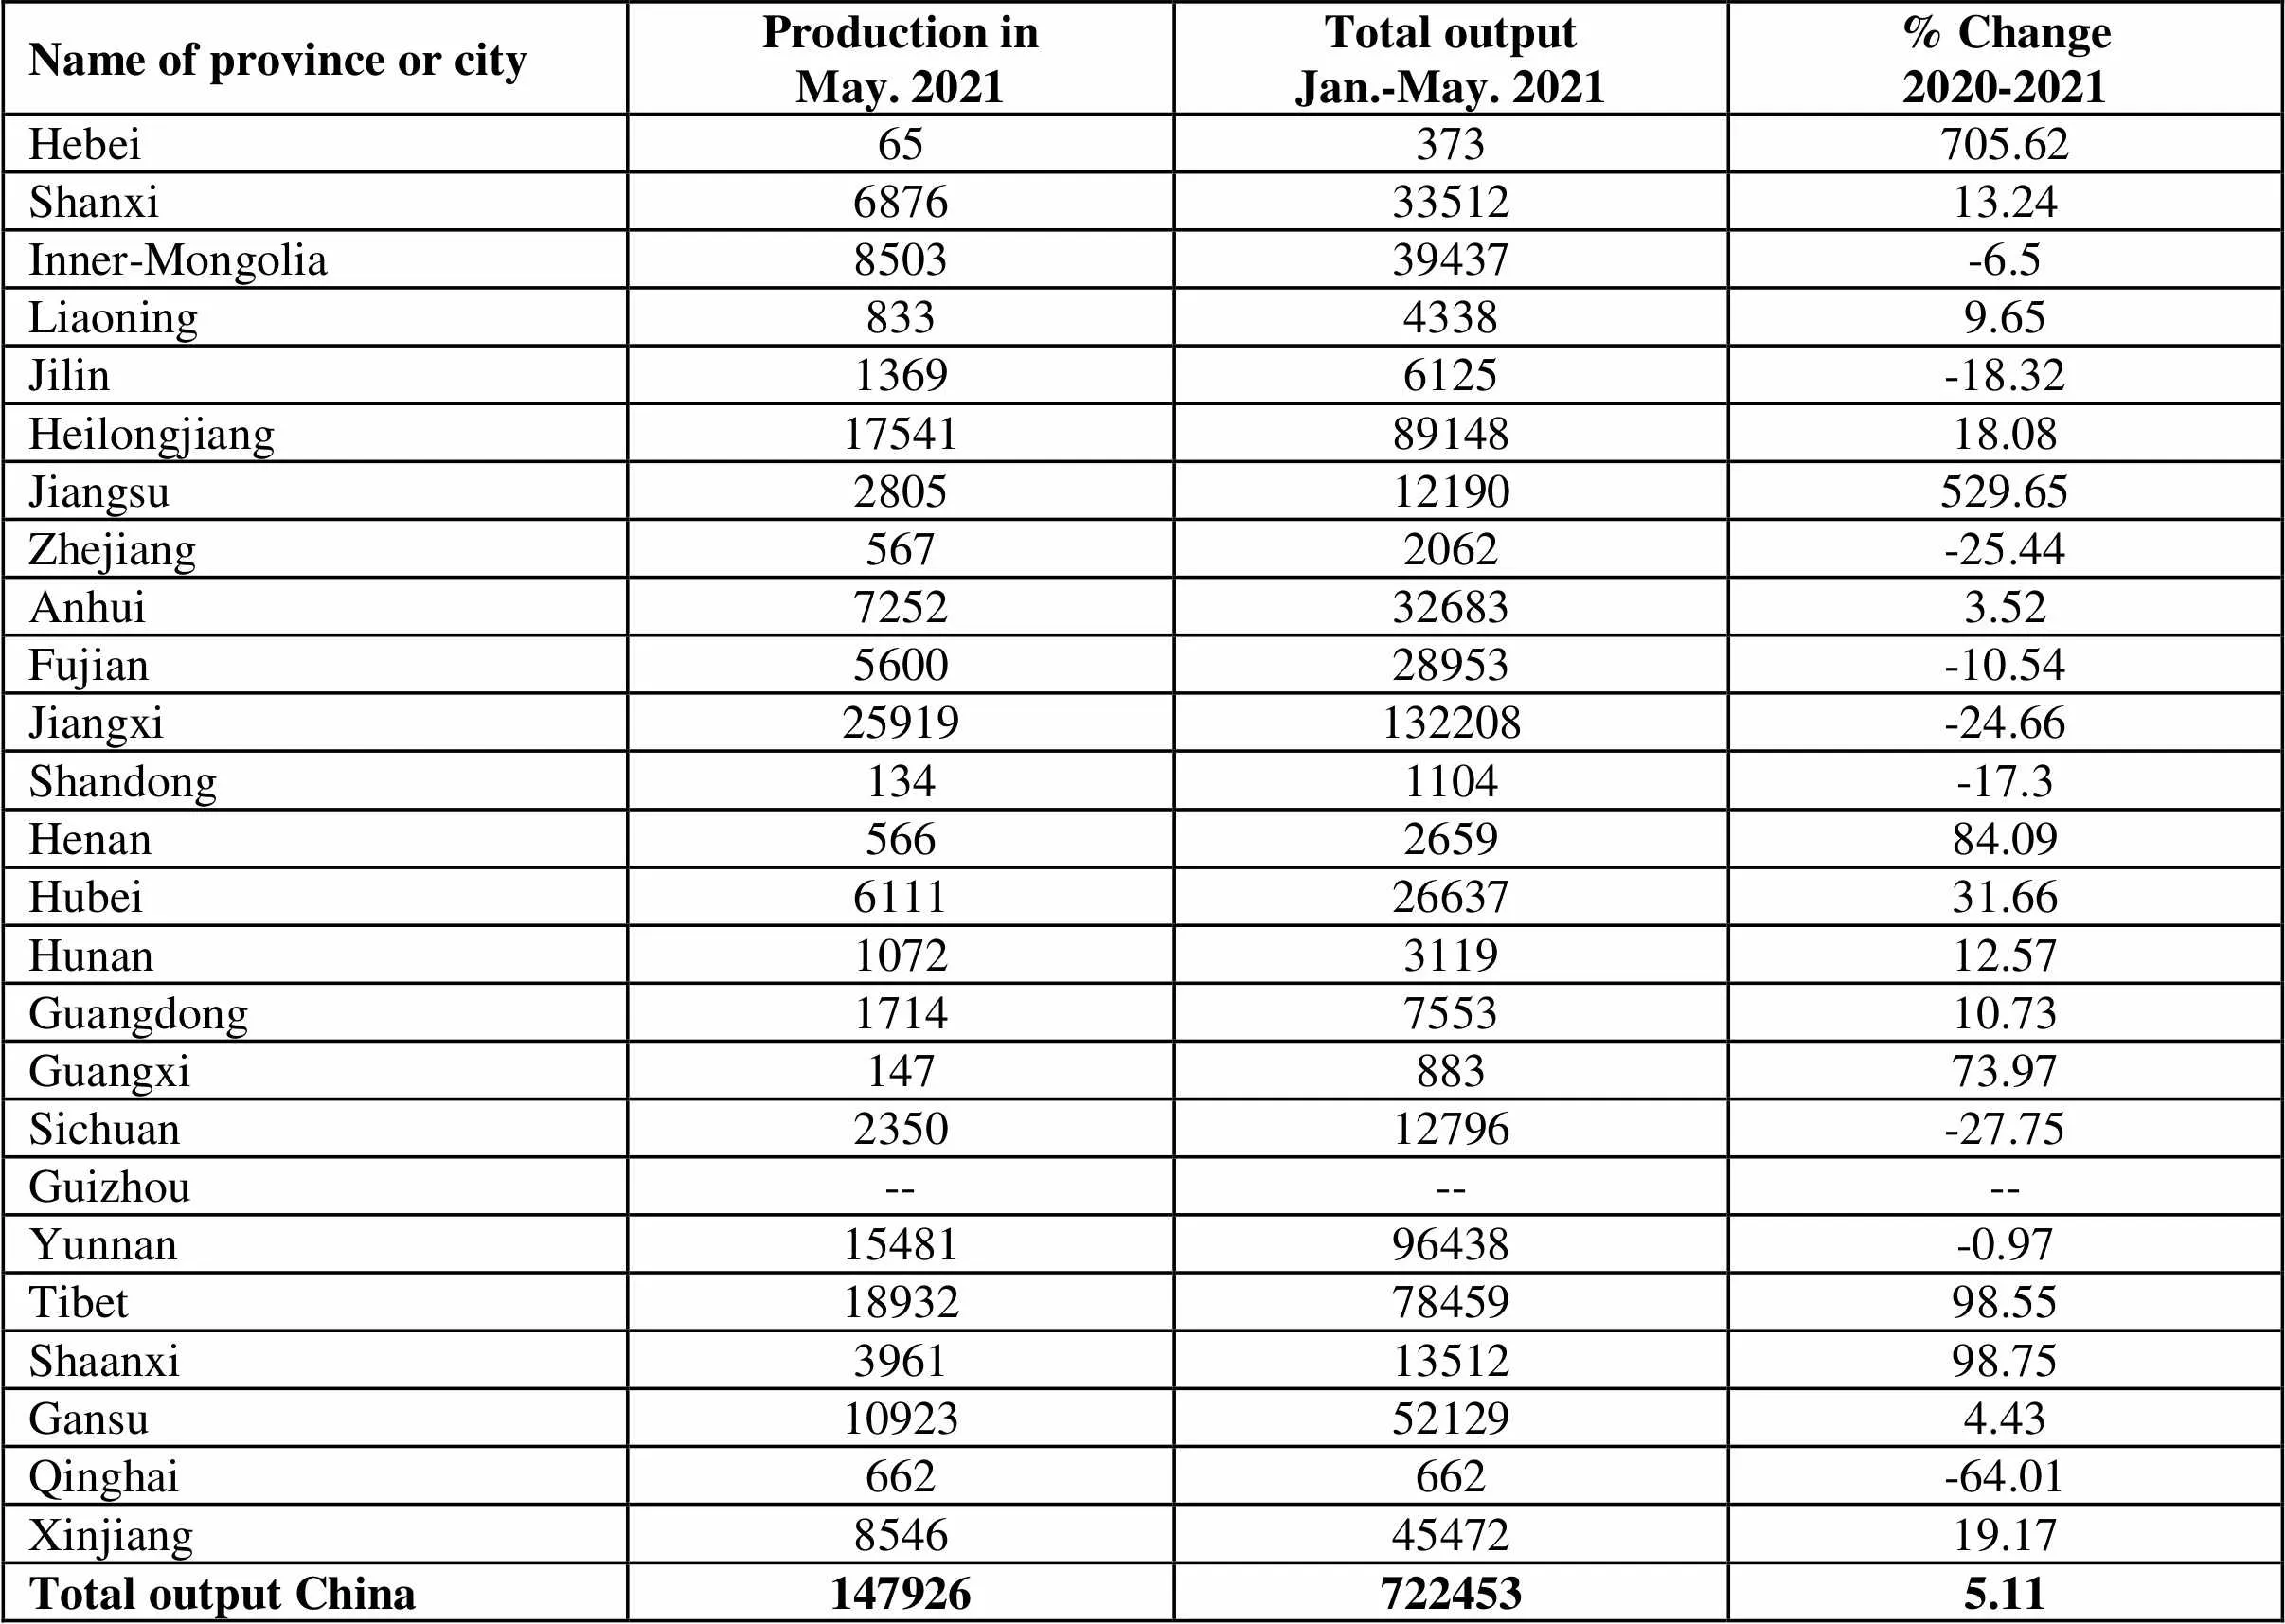
Name of province or cityProduction inMay. 2021Total outputJan.-May. 2021% Change2020-2021 Hebei65373705.62 Shanxi68763351213.24 Inner-Mongolia850339437-6.5 Liaoning83343389.65 Jilin13696125-18.32 Heilongjiang175418914818.08 Jiangsu280512190529.65 Zhejiang5672062-25.44 Anhui7252326833.52 Fujian560028953-10.54 Jiangxi25919132208-24.66 Shandong1341104-17.3 Henan566265984.09 Hubei61112663731.66 Hunan1072311912.57 Guangdong1714755310.73 Guangxi14788373.97 Sichuan235012796-27.75 Guizhou------ Yunnan1548196438-0.97 Tibet189327845998.55 Shaanxi39611351298.75 Gansu10923521294.43 Qinghai662662-64.01 Xinjiang85464547219.17 Total output China1479267224535.11
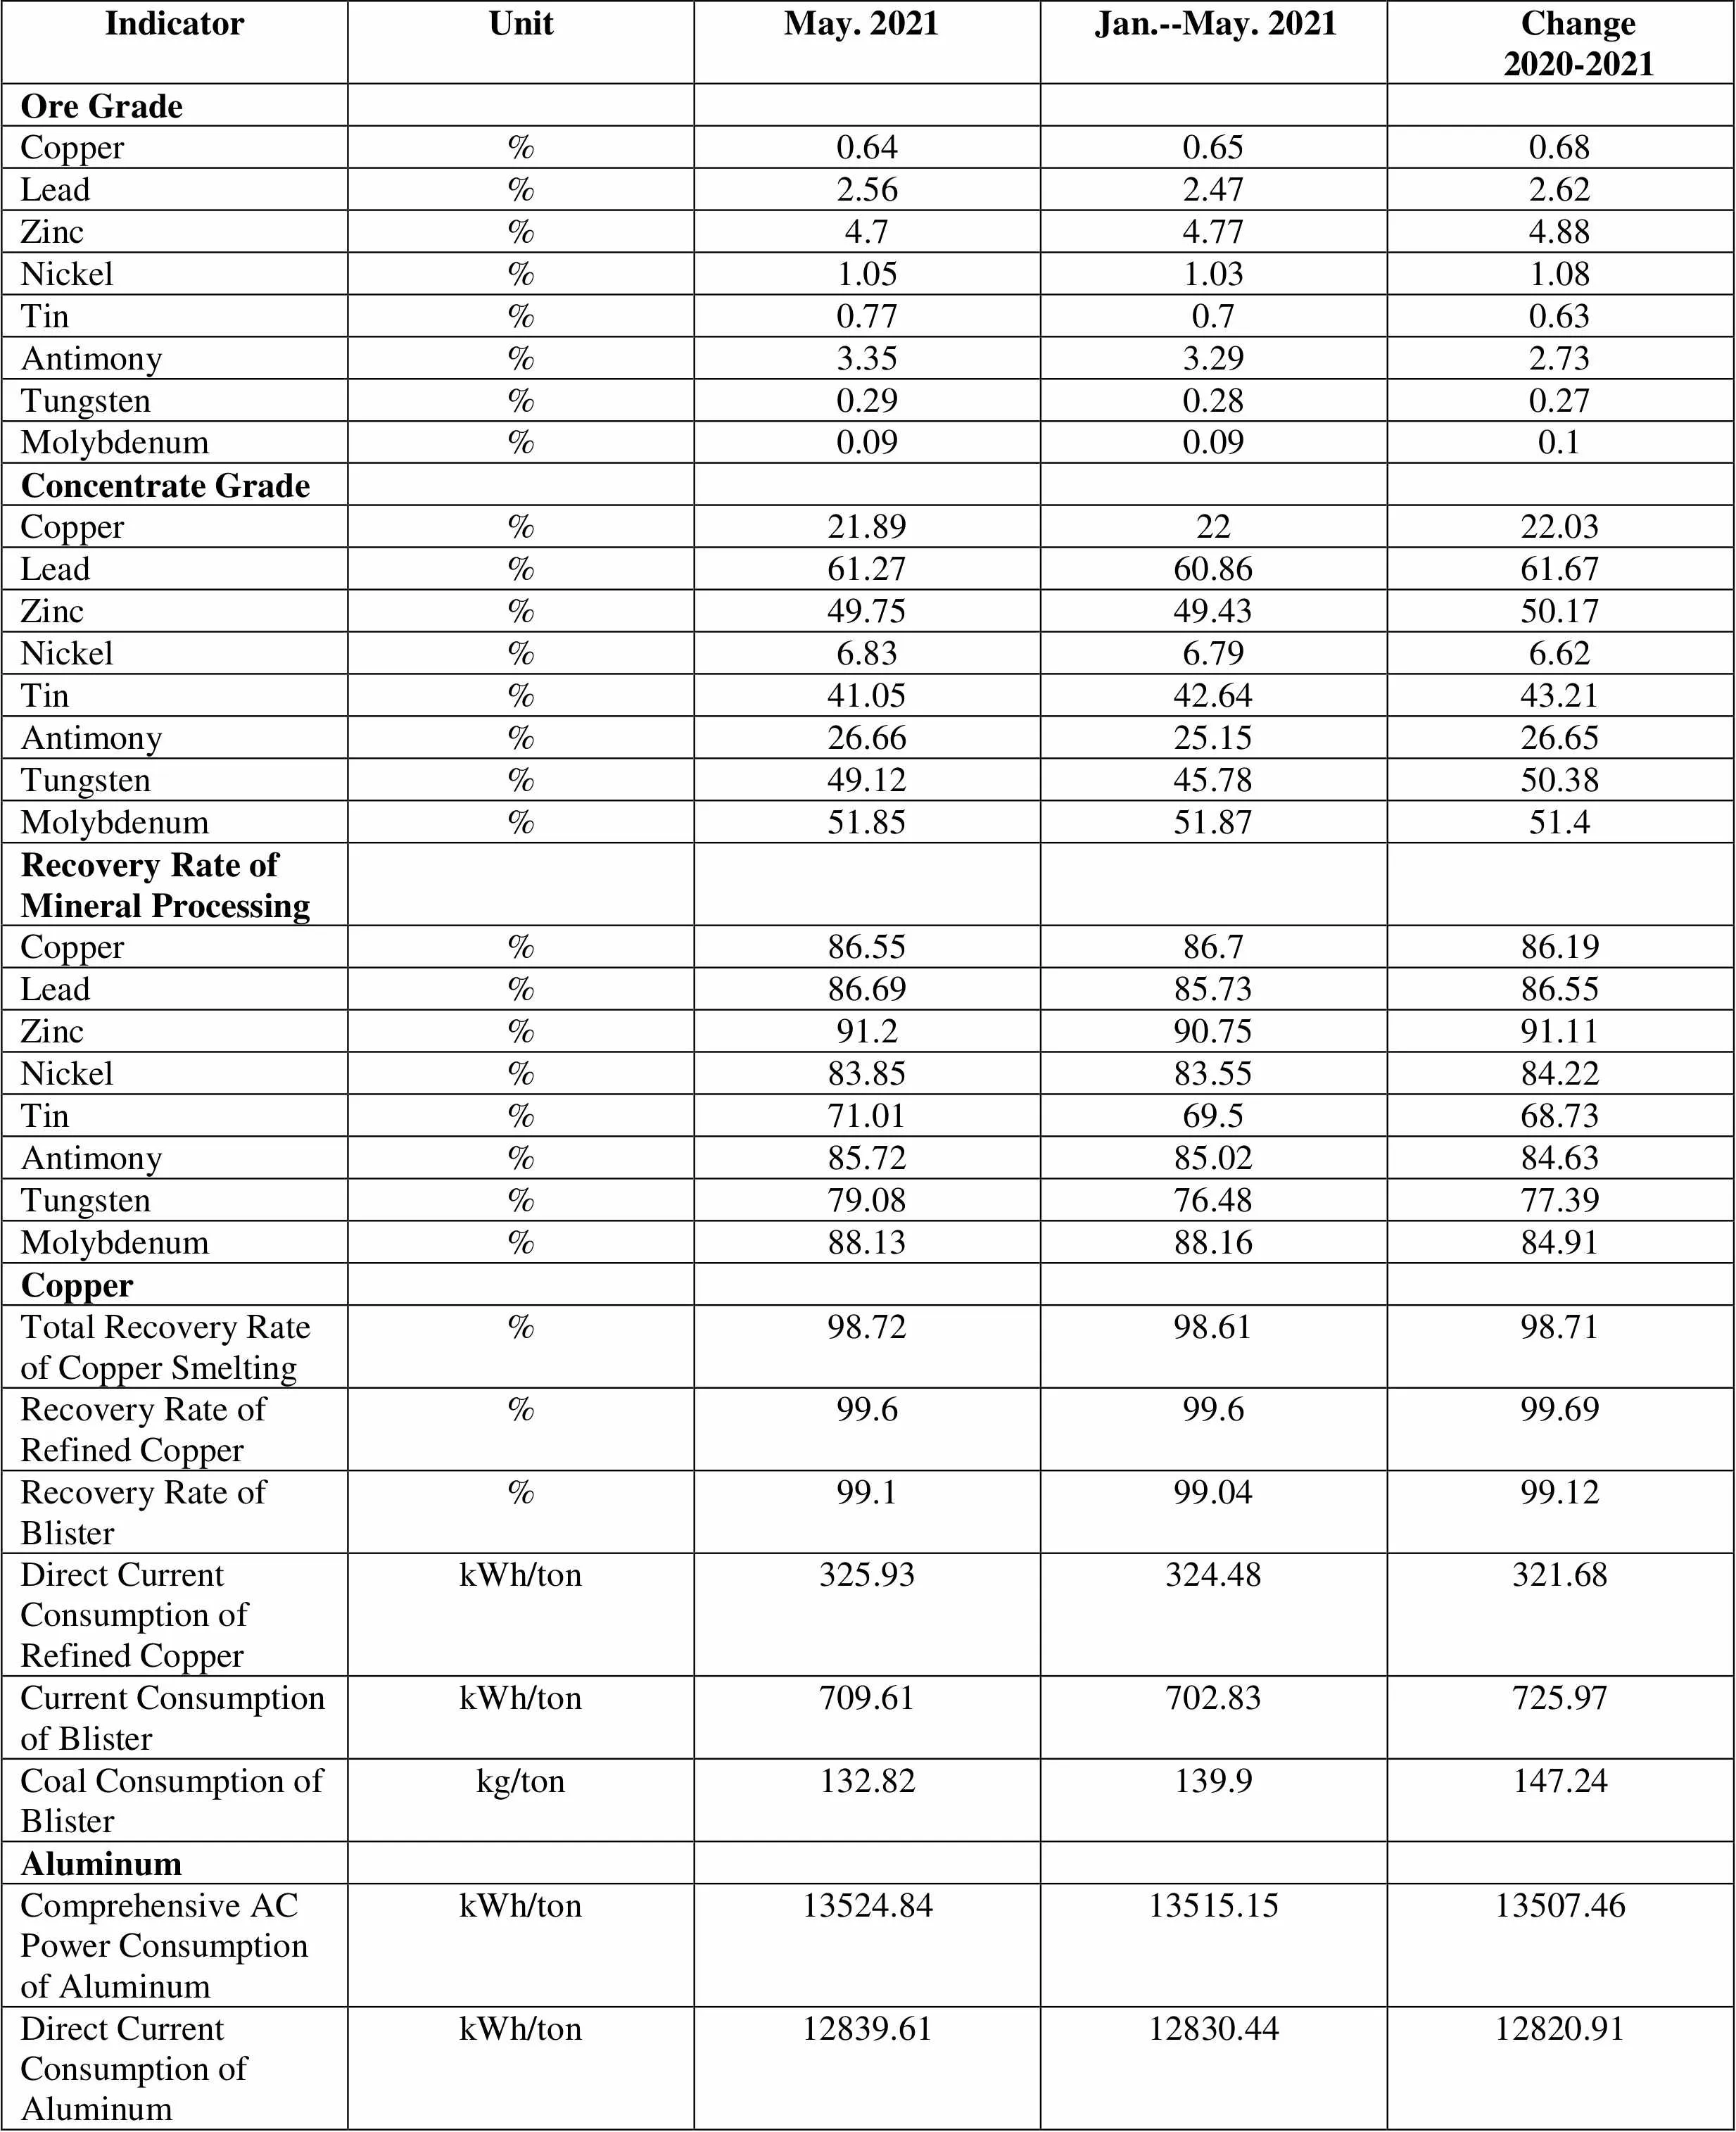
IndicatorUnitMay. 2021Jan.--May. 2021 Change 2020-2021 Ore Grade Copper%0.640.650.68 Lead%2.562.472.62 Zinc%4.74.774.88 Nickel%1.051.031.08 Tin%0.770.70.63 Antimony%3.353.292.73 Tungsten%0.290.280.27 Molybdenum%0.090.090.1 Concentrate Grade Copper%21.892222.03 Lead%61.2760.8661.67 Zinc%49.7549.4350.17 Nickel%6.836.796.62 Tin%41.0542.6443.21 Antimony%26.6625.1526.65 Tungsten%49.1245.7850.38 Molybdenum%51.8551.8751.4 Recovery Rate of Mineral Processing Copper%86.5586.786.19 Lead%86.6985.7386.55 Zinc%91.290.7591.11 Nickel%83.8583.5584.22 Tin%71.0169.568.73 Antimony%85.7285.0284.63 Tungsten%79.0876.4877.39 Molybdenum%88.1388.1684.91 Copper Total Recovery Rate of Copper Smelting%98.7298.6198.71 Recovery Rate of Refined Copper%99.699.699.69 Recovery Rate of Blister%99.199.0499.12 Direct Current Consumption of Refined CopperkWh/ton325.93324.48321.68 Current Consumption of BlisterkWh/ton709.61702.83725.97 Coal Consumption of Blisterkg/ton132.82139.9147.24 Aluminum Comprehensive AC Power Consumption of AluminumkWh/ton13524.8413515.1513507.46 Direct Current Consumption of AluminumkWh/ton12839.6112830.4412820.91
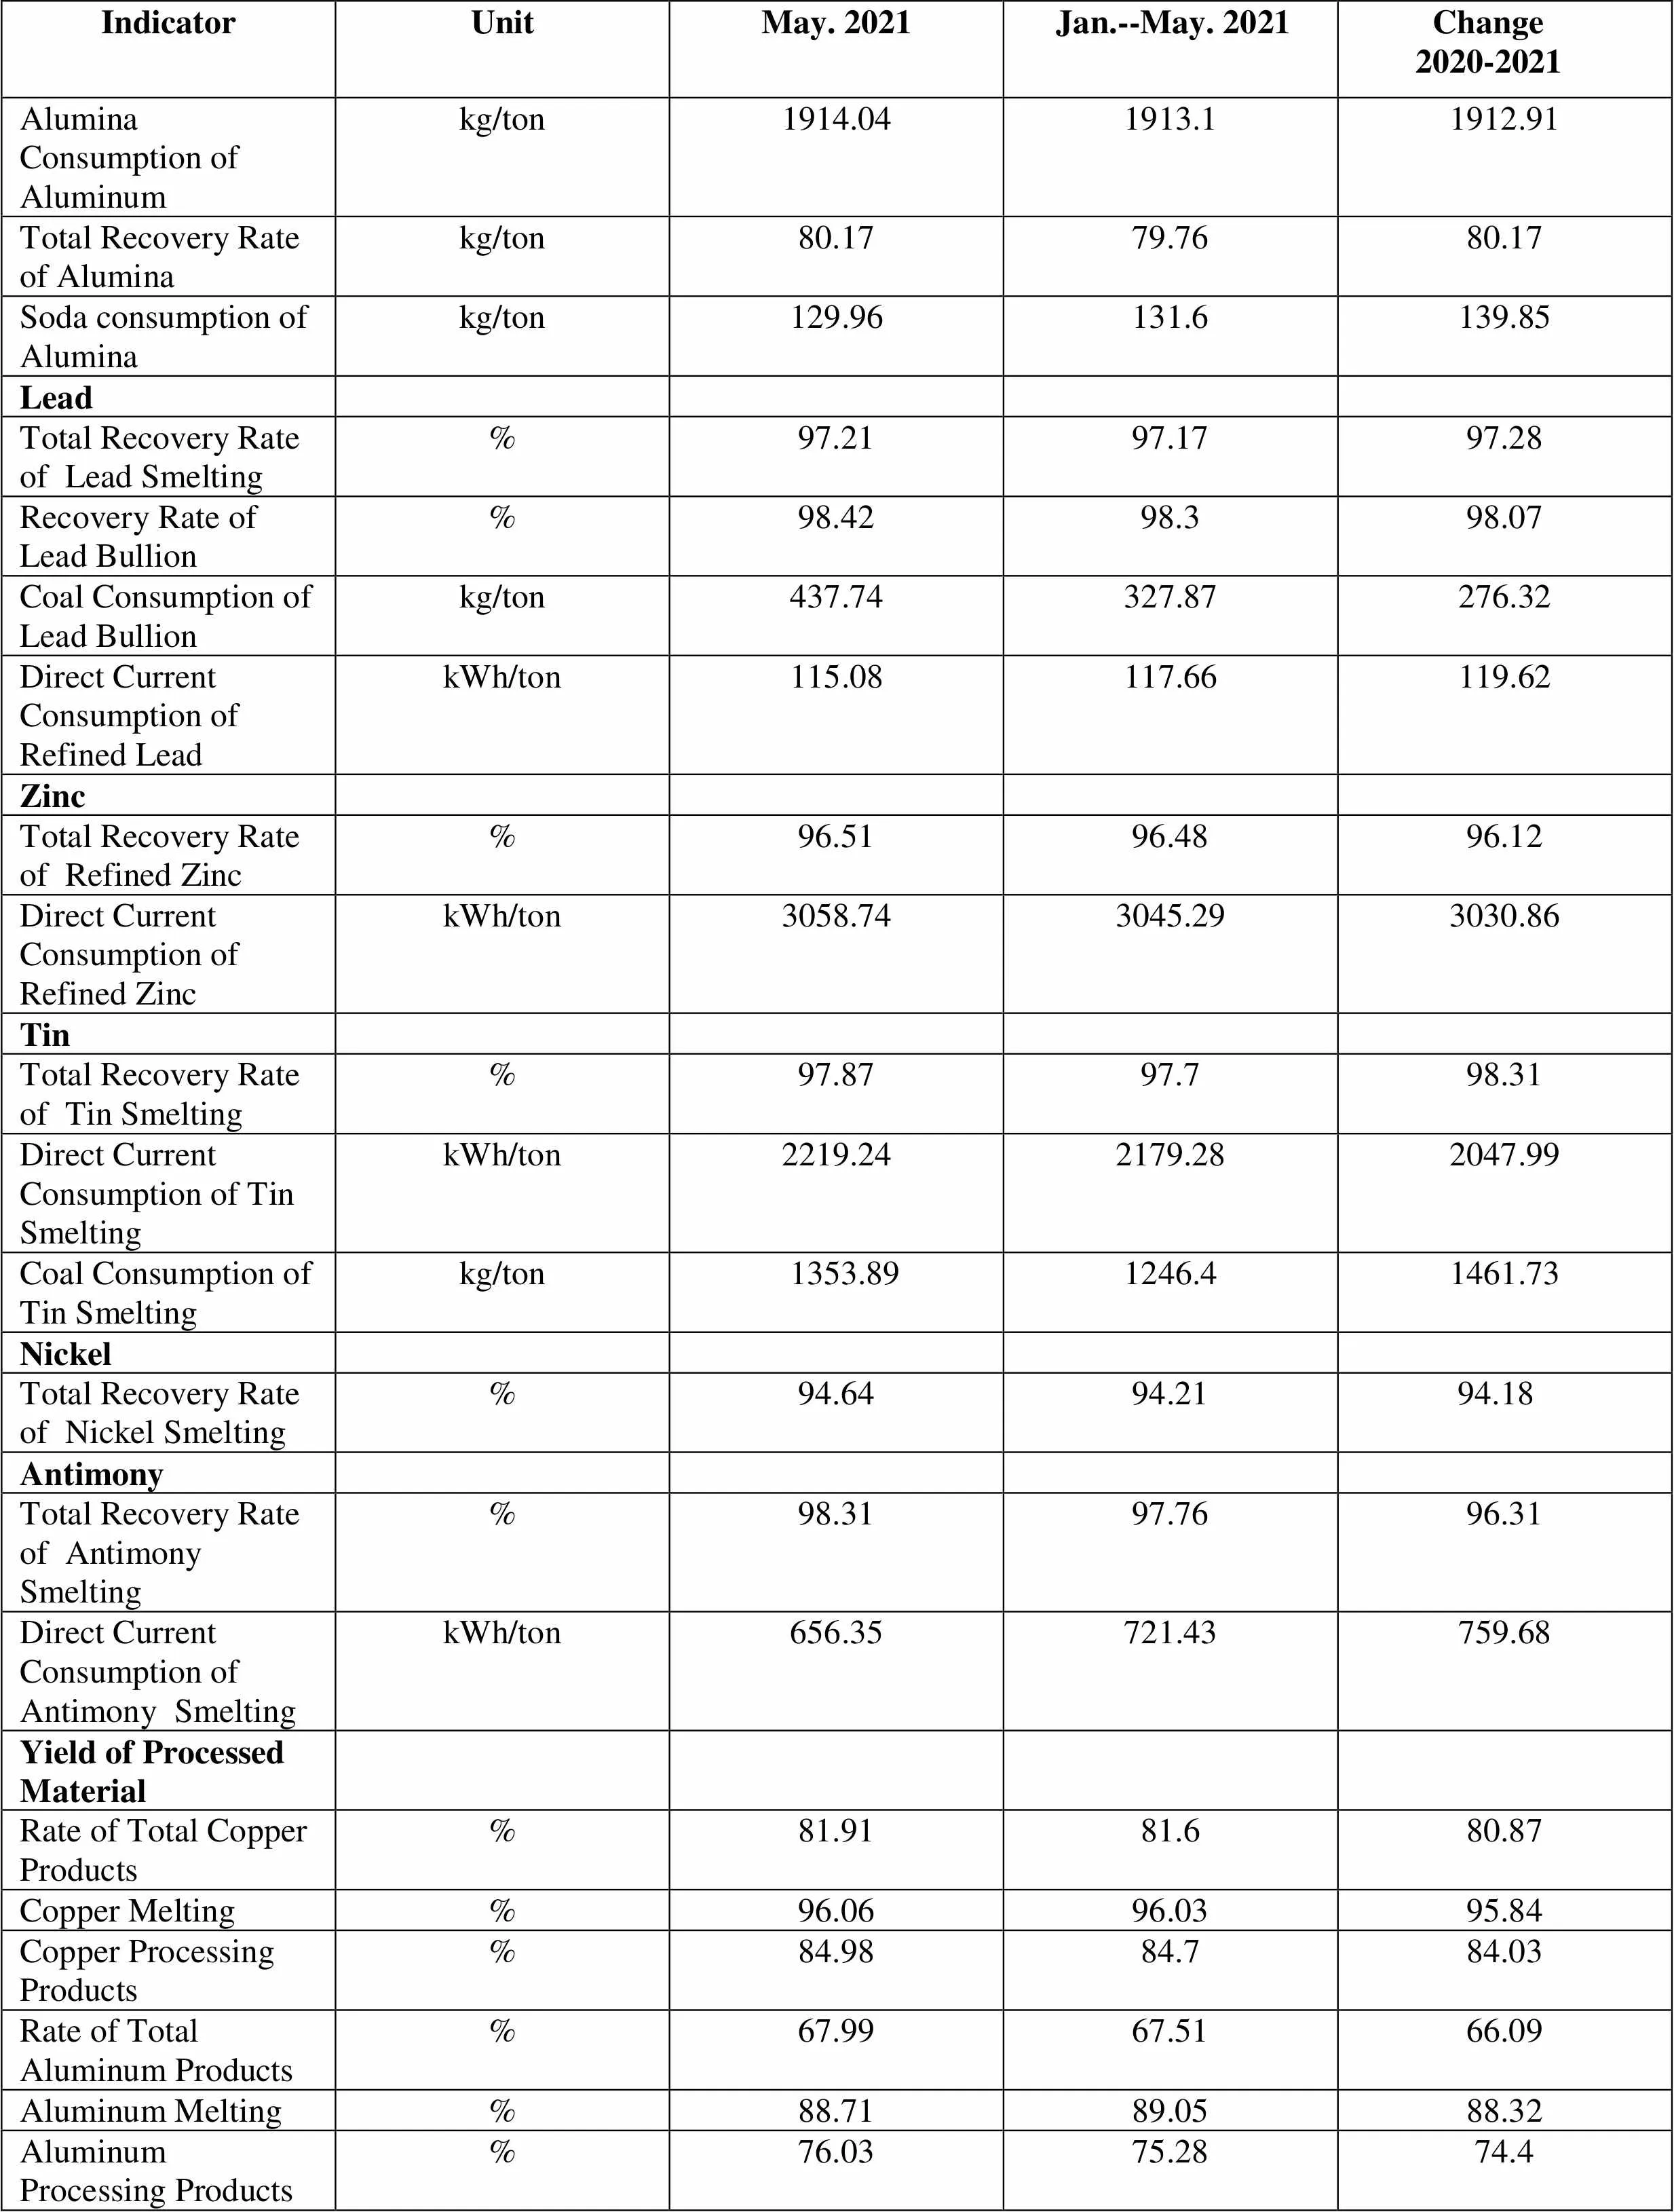
IndicatorUnitMay. 2021Jan.--May. 2021 Change 2020-2021 Alumina Consumption of Aluminumkg/ton1914.041913.11912.91 Total Recovery Rate of Aluminakg/ton80.1779.7680.17 Soda consumption of Aluminakg/ton129.96131.6139.85 Lead Total Recovery Rate of Lead Smelting%97.2197.1797.28 Recovery Rate of Lead Bullion%98.4298.398.07 Coal Consumption of Lead Bullionkg/ton437.74327.87276.32 Direct Current Consumption of Refined LeadkWh/ton115.08117.66119.62 Zinc Total Recovery Rate of Refined Zinc%96.5196.4896.12 Direct Current Consumption of Refined ZinckWh/ton3058.743045.293030.86 Tin Total Recovery Rate of Tin Smelting%97.8797.798.31 Direct Current Consumption of Tin SmeltingkWh/ton2219.242179.282047.99 Coal Consumption of Tin Smeltingkg/ton1353.891246.41461.73 Nickel Total Recovery Rate of Nickel Smelting%94.6494.2194.18 Antimony Total Recovery Rate of Antimony Smelting%98.3197.7696.31 Direct Current Consumption of Antimony SmeltingkWh/ton656.35721.43759.68 Yield of Processed Material Rate of Total Copper Products%81.9181.680.87 Copper Melting %96.0696.0395.84 Copper Processing Products%84.9884.784.03 Rate of Total Aluminum Products%67.9967.5166.09 Aluminum Melting%88.7189.0588.32 Aluminum Processing Products%76.0375.2874.4
Unit: metric ton
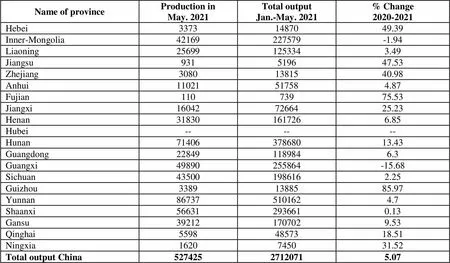
Name of provinceProduction inMay. 2021Total outputJan.-May. 2021% Change2020-2021 Hebei33731487049.39 Inner-Mongolia42169227579-1.94 Liaoning256991253343.49 Jiangsu931519647.53 Zhejiang30801381540.98 Anhui11021517584.87 Fujian11073975.53 Jiangxi160427266425.23 Henan318301617266.85 Hubei------ Hunan7140637868013.43 Guangdong228491189846.3 Guangxi49890255864-15.68 Sichuan435001986162.25 Guizhou33891388585.97 Yunnan867375101624.7 Shaanxi566312936610.13 Gansu392121707029.53 Qinghai55984857318.51 Ningxia1620745031.52 Total output China52742527120715.07
 China Nonferrous Metals Monthly2021年7期
- China Nonferrous Metals Monthly的其它文章
- Xiamen Tungsten Plans to Build A New Bar Production Line
- Huayou Cobalt Plans to Issue Convertible Bond to Invest in Ternary Cathode Materials
- North Rare Earth Plans to Invest in Constructing National Rare Earth New Materials Innovation Base Project
- National Development and Reform Commission and Other Four Departments Had Meetings with Key Bulk Commodity Companies
- Two Departments Jointly Released Implementation Opinions on Further Improving Abilities to Assure Charging Infrastructure Service (Exposure Draft)