
Spectral characteristic of laser-induced plasma in soil
2020-01-10 07:40:50YangYU余洋NanjingZHAO趙南京ZhigaoLAN蘭智高DeshuoMENG孟德碩andMingjunMA馬明俊
Plasma Science and Technology 2020年1期
關鍵詞:南京
Yang YU (余洋), Nanjing ZHAO (趙南京), Zhigao LAN (蘭智高),Deshuo MENG (孟德碩) and Mingjun MA (馬明俊)
1 College of Physics and Electronic Information, Huang Gang Normal University, Huanggang 438000,People's Republic of China
2 Key Laboratory of Environmental Optics and Technology,Anhui Institute of Optics and Fine Mechanics,Chinese Academy of Sciences, Hefei 230031, People's Republic of China
Abstract The spectral characteristic of laser-induced plasma in soil was studied in this work,laser-induced breakdown spectroscopy was used to analyze the spectral characteristic of plasma under the condition of different time delays and irradiances.Moreover,the time evolution characteristics of plasma temperature and electron density were discussed.Within the time delay range of 0-5 μs,the spectral intensity of the characteristic lines of Si I: 288.158 nm, Ti I: 336.126 nm, Al I:394.400 nm and Fe I: 438.354 nm of the four main elements in two kinds of national standard soil decayed exponentially with time. The average lifetime of the spectral lines was nearly 1.56 μs.Under the condition of different time delays,the spectral intensity of Pb I:405.78 nm in soil increased linearly with laser energy. However, the slope between the spectral intensity and laser energy decreased exponentially with the increase in time delay, from 4.91 to 0.99 during 0-5 μs. The plasma temperature was calculated by the Boltzmann plot method and the electron density was obtained by inversion of the full width at half maximum of the spectrum. The plasma temperature decreased from 8900 K to 7800 K and the electron density decreased from 1.5 × 1017 cm?3 to 7.8 × 1016 cm?3 in the range of 0-5 μs.
Keywords: LIBS, soil, delay time, laser energy, plasma temperature, electron density(Some figures may appear in colour only in the online journal)
1. Introduction
With the acceleration of industrialization,discharges of heavy metals from electroplating, mining, chemical and mechanical manufacturing industries are becoming increasingly prominent. This has posed a serious threat to the ecological environment and human health.Rapid and accurate detection of heavy metals is key to the prevention and control of heavy metal discharge. At present, heavy metals in soil are commonly detected using laboratory methods such as inductively coupled plasma mass spectrometry[1]and atomic absorption spectrometry [2]; these methods have high sensitivity and accuracy for heavy metal detection. However, they also have some disadvantages, for example, complex sample pretreatment process,high time consumption,and expensive and high requirements for operators. Thus, real-time and fast analysis of heavy metals cannot be realized using these methods.
Laser-induced breakdown spectroscopy(LIBS)[3,4]has several advantages such as fast analysis, no sample pretreatment, easy operation and analysis of different specimens. In recent years, researchers have carried out related research work on environment [5-9], steel [10-13], food [14-16],ocean [17-19], energy [20, 21], space exploration [22, 23],and biology [24, 25]. However, LIBS is also faced with difficulties of low quantitative accuracy and high detection limit.
Spectral characteristic analysis is the basis of quantitative analysis in LIBS, which is closely related to the experimental parameters. Haider et al measured the radiative lifetime of excited neutral nitrogen atoms by time-resolved LIBS; the values were largely consistent with the calculated value of lifetime given by Hibbert [26]. Sirven et al used LIBS to measure standard metallic samples; the measurement was found to linearly depend on the pulse energy over the range of investigation, and this behavior was related to the increase of the number of vaporized atoms when the pulse energy was increased [27]. Dong et al used LIBS to analyze spectral characterization of nitrogen in farmland soil;the effects of laser energy on spectral characteristic and the time evolution characteristic of LIBS were studied to determine the basis of parameter optimization for the measurement[28].Pardini et al recorded Balmer lines of hydrogen under the condition of different time delays and evaluated the electron density of plasma through the measurement of the Stark broadening; the experimental results were compared with theoretical predictions [29]. However, investigation of the time evolution characteristic of laser-induced plasma in different types of soil has been seldom presented,and the variation law of slope between spectral intensity and laser energy has not yet been reported.
In this study,the time evolution characteristic of LIBS in soil was investigated and the lifetime of characteristic lines were also determined. The influence of laser energy on the spectral characteristic was studied under the condition of different time delays,and the time evolution of slope between spectral intensity and laser energy was further discussed.The evolutions of plasma temperature and electron density of plasma were also analyzed in this study.
2. Experimental system and samples
2.1. Experimental system
An Nd:YAG pulsed laser was used as the excitation source with a 1064 nm central wavelength and a 5 ns pulse width(Brilliant type, Quantel Company, France); its energy was adjustable. The pulse laser was reflected by the 1064 nm total reflector; a spot with high peak irradiance was produced by the convergence of a flat convex lens(focal length 50 mm), which acted on the surface of the sample instantaneously and produced a plasma. The spectral signal emitted by the plasma was coupled to the fiber by the convex lens (focal length 30 mm). The spectral signal was separated by a medium-step grating spectrometer (Mechell 5000, Andor Company, UK); the spectral detection range was 200-850 nm, and the spectral resolution was λ /Δλ = 5000.The signal was eventually detected by ICCD (intensified charge coupled device, i Star, Andor Company,UK) with a pixel size of ICCD is 1024 × 1024. The samples were placed on a rotating two-dimensional mobile platform; the time delay of spectral signal acquisition was controlled by a four-channel digital delay pulse generator(DG535, SRS Company, America), and the time series between the laser pulse and two-dimensional platform rotation was also controlled by DG535. The experimental system is shown in figure 1.
2.2. Samples
The standard solution was prepared with Pb(NO3)2and deionized water; samples containing Pb were prepared by mixing the standard solution with national standard soil(GBW-07405,GBW-07408). The samples were air-dried, grinded and sifted(100 mesh); each sample weighed 2.8 g as measured by an electronic balance and was pressed into a round cake with a diameter of 30 mm and a thickness of 2.6 mm.
3. Results and discussion
3.1. Spectral characteristic of plasma under the condition of different time delays
Plasma was produced by the interaction between a pulsed laser with high peak irradiance and the sample; the plasma gradually decayed and disappeared. Four main elements, Si,Ti, Al, and Fe, in the national standard soil were selected as analytical objects. In the 0-5 μs of plasma evolution, the samples were measured five times under the condition of each time delay (with interval of 0.5 μs). The spectra of each measurement were accumulated by 10 laser pulses, and the final result was the average value of the five measurements.The time evolution characteristic of the spectral intensity of the four characteristic lines, Si I: 288.158 nm, Ti I:336.126 nm, Al I: 394.400 nm, and Fe I: 438.354 nm, are shown in figures 2(a)-(d).
The results in figures 2(a)-(d) indicated that the spectral intensity of four characteristic lines, Si I: 288.158 nm, Ti I:336.126 nm,Al I:394.400 nm,and Fe I:438.354 nm,differed considerably in the initial stage.With gradual evolution of the characteristic lines, the difference between the spectral intensity of the characteristic lines also diminished gradually.The evolution law of spectral intensity was basically the same, and the spectral intensity of the characteristic lines decreased exponentially with the time delay. The spectral intensity I can be expressed as:
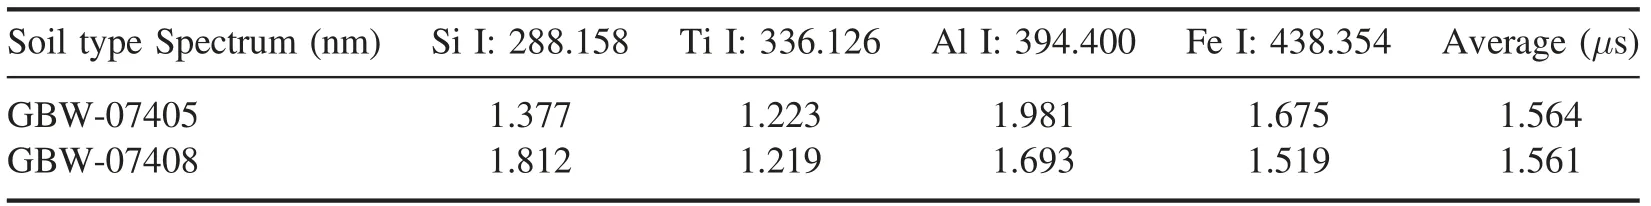
Table 1.Lifetime of four characteristic lines in two national standard soils.
where I0and A are constants, andτ is the lifetime of the characteristic line. The lifetime of spectral intensity of the four characteristic lines was determined by exponential decay function fitting; the corresponding results are shown in table 1.
The above results showed that the lifetime of the characteristic spectral lines of the four main elements in the soil samples was different and ranged over 1.0-2.0 μs. For two different types of national standard soils,the average lifetime of the four characteristic lines was approximately 1.56 μs.This finding has important guiding significance for the determination of time delay in simultaneous measurement of multiple elements.
3.2. Spectral characteristic of plasma under the condition of different irradiances
In the measurement and analysis of LIBS, laser energy has a significant influence on the spectral characteristic of plasma radiation. The process of plasma excitation, emission and evolution is influenced by the laser energy.With the increase of laser energy, the number of ablated samples will increase;therefore, the spectral intensity of plasma radiation will increase. However, the evolution of spectral intensity of characteristic lines with laser energy under the condition of different time delays has not been thoroughly studied.Within the time delay of 0-5 μs, the samples were measured five times under the condition of each time delay(with intervals of 0.5 μs); the spectra of each measurement were accumulated by 10 laser pulses, and the final result was the average value of the five measurements. The dependence of the spectral intensity of the characteristic line Pb I:405.78 nm on the laser energy under the condition of different time delays is shown in figures 3(a)-(f).
The results in figures 3(a)-(f)indicated that the spectral intensity of Pb I: 405.78 nm increased linearly with the increase of laser energy in the range of 50-280 mJ.Figure 4 shows the relationship between the slope of spectral intensity versus laser energy and time delay in the range of 0-5 μs.
The results in figure 4 showed that the slope of spectral intensity of the characteristic line Pb I: 405.78 nm versus laser energy decreased exponentially with the increase of the time delay.The slope of spectral intensity of the characteristic line versus laser energy differed significantly for different time delays. The slope decreased from 4.91 to 0.99 during 0-5 μs. This illustrates that the change trend of spectral intensity with laser energy became smaller with the evolution of plasma, i.e., the influence of laser energy on the spectral characteristic of plasma radiation became weaker.The reason was that the spectral intensity of plasma radiation decreased significantly with the increase of time delay. The slope of spectral intensity versus laser energy was large during the initial period of plasma evolution. As the time delay increased, the variation of spectral intensity was relatively flat, i.e., the variation of spectral intensity with laser energy became smaller.
3.3.Time evolution of plasma temperature and electron density
The spectral characteristic of plasma radiation is closely related to the plasma temperature and electron density.Therefore, it is necessary to measure and study the evolution of plasma temperature and electron density for analyzing and understanding the spectral characteristic of plasma radiation.
3.3.1. Plasma temperature. Under the assumption of local thermal equilibrium,plasma temperature can be calculated by the Boltzmann plot method as:
In the above formula, I is the intensity of spectral line, h is the Planck constant,N is the density of particle number,g is the degeneracy factor of upper level, A is the transition probability,λ is the wavelength of spectral line, Z is the partition function,E is the energy of upper level,and k is the Boltzmann constant.
Considering the wide distribution and large number of characteristic lines of Fe element in the samples, 13 characteristic lines of Fe in the wavelength range of 360-450 nm were selected for the analysis [30], the energy levels and related parameters were quoted from the website of NIST[3].Under the condition of laser energy 174.5 mJ,time delay td= 1.0 μs,and acquisition gate width tg= 0.5 μs,and average temperatures are measured with a gate-width of 0.5 μs.The Boltzmann diagram of Fe is shown in figure 5(a),and the time evolution characteristic of plasma temperature is shown in figures 5(b).
3.3.2.Electron density. The broadening mechanism involves natural broadening,Doppler broadening and Stark broadening in LIBS plasma spectroscopy. However, the most important contribution to linewidth is Stark broadening (the instrument width is 0.01 nm,the Doppler width is 0.005 nm).The electric field causing Stark effect is mainly contributed by the collision between electrons. Therefore, Stark broadening is related to the electron density. Ignoring the effect of ion broadening, the relationship between the full width at half maximum of the Lorentz fitting curve, Δλ1/2,and electron density in plasma, Ne,is given by the following formula:
In the above formula,ω is the electron collision parameter [31]. The characteristic line Ca I: 422.67 nm was fitted by the Lorentz function; the Lorentz fitting results and time evolution of electron density are shown in figures 6(a)-(b).
The results shown in figures 5 and 6 indicated that the plasma temperature decreased linearly with time;it decreased from 8900 K to 7800 K in the range of 0-5 μs. Thus, the plasma temperature decreased by 1100 K(nearly 12.4%).The electron density decreased exponentially with time; it decreased from 1.5 × 1017cm?3to 7.8 × 1016cm?3within the range of 0 ~ 5 μs. Hence, the electron density decreased by approximately 50%. Plasma was produced by the interaction between pulsed laser and matter. The plasma expanded and cooled with time, and the degree of collision between particles in plasma became weaker. The number of particles per unit volume reduced, so plasma temperature decreased and the electron density became lesser. This was also the essential reason why the spectral intensity of plasma radiation decreased with time.
4. Conclusions
In this study, the time evolution of spectral intensity of two kinds of national soil was analyzed by LIBS; the average lifetime of spectral lines of four main elements was nearly 1.56 μs. This observation is helpful for the determination of time delay in the simultaneous measurement of multiple elements.The spectral intensity increased with the increase of laser energy over the range of 50-280 mJ (corresponding to peak irradiance of 3.18 × 10¹²-1.78 × 10¹³W cm?2; spot radiusω was approximately 10 μm order of magnitude by simulation[32],pulse widthΔt was 5 ns,and focal length of lens was 50 mm, the peak irradiance was calculated by the formula E / (Δ t · πω2)); the peak irradiance of laser(TW cm-2) was far beyond the threshold of optical breakdown of soil(GW cm-2).The slope of spectral intensity of Pb I:405.78 nm versus laser energy decreased from 4.91 to 0.99 during the time delay of 0-5 μs. This illustrated that the influence of irradiance on spectral characteristic became weaker as the time delay increased.Within 0-5 μs,the plasma temperature and electron density decreased by nearly 12.4%and 50%, respectively.
Acknowledgments
This work is supported by the Special Project of Knowledge Innovation of Hubei Province (No. 2018CFC862), National Natural Science Foundation of China (No. 61705238), the National High Technology Research and Development Program of China (No. 2014AA06A513).
猜你喜歡
中國自動識別技術(shù)(2023年6期)2024-01-12 08:13:22
環(huán)球時報(2022-08-16)2022-08-16 15:13:53
兒童故事畫報(2020年8期)2020-10-30 01:58:28
學生天地(2020年31期)2020-06-01 02:32:22
金色年華(2017年8期)2017-06-21 09:35:27
金色年華(2017年7期)2017-06-21 09:27:54
電影(2017年1期)2017-06-15 16:28:04
中國化肥信息(2016年41期)2016-05-17 04:25:59
新高考·英語進階(高二高三)(2016年1期)2016-03-05 09:05:18
連環(huán)畫報(2015年8期)2015-12-04 11:29:31
 Plasma Science and Technology2020年1期
- Plasma Science and Technology的其它文章
- Experimental study of current loss of a single-hole post-hole convolute on the QG I generator
- Development of a data acquisition and control system for the International Thermonuclear Experimental Reactor neutron flux monitor
- Effect of the amount of trapped particulate matter on diesel particulate filter regeneration performance using nonthermal plasma assisted by exhaust waste heat
- The effect of atmospheric pressure glow discharge plasma treatment on the dyeing properties of silk fabric
- Weighted-averaging-based classification of laser-induced breakdown spectroscopy measurements using most informative spectral lines
- Numerical simulation of atmospheric pulsemodulated radio-frequency glow discharge ignition characteristics assisted by a pulsed discharge