
Cultivated Land Monitoring System Based on Dynamic Wake-Up UAV and Wireless of Distributed Storage
2019-11-26 06:47:28XinweiZhangYanghongZhangLeiYangandXiangduYan
Computers Materials&Continua 2019年11期
Xinwei ZhangYanghong ZhangLei Yangand Xiangdu Yan
Abstract:The drawbacks of the traditional multi-hop structure of wireless sensor networks (WSNS)are susceptible to reflection,scattering and diffraction,serious attenuation of signal intensity and phase deviation due to various obstacles in cultivated land environment and mountains.In this paper,the wireless signal intensity is measured and curve fitting is done respectively in both open environment and obstacle-environment with both sending and receiving height of 0 m,1 m,and 2 m.It is found out that packet loss probability is too high when an obstacle exists.In such a case,unmanned aerial vehicle (UAV)is introduced to activate terrestrial nodes and operation mechanism of distributed storage.Experimental results show that both ground-to-air barrier-free communication and communication with obstacles can greatly reduce the energy consumption of each node and packet loss probability,thus greatly improving the reliability of UAV-WSN system.
Keywords:Unmanned aerial vehicle,wireless sensor network,signal intensity.
1 Introduction
Cultivated land is the natural resources that will not increase naturally.Under the condition of limited land resources,it is of great significance to strengthen guidance for cultivated land protection,improve the quality of cultivated land,cultivated land quality management and ensure national food security and agricultural sustainable development by monitoring the quality of existing cultivated land in different areas with the aid of the modern methods.
With the development of electronic technology,agricultural monitoring technology changes with each passing day,and the Internet of things technology is more widely applied to agricultural monitoring [Yang,He and Zhang (2017)].The research on the application of wireless sensor network to the acquisition of agricultural situation information is a hot topic in recent years [Kar and Misra (2016)].However,it is rare to introduce UAVs into the wireless sensor network of farmland monitoring.The application of UAV in the agricultural field bears great potential,which can greatly improve agricultural modernization level and promote the development of modern agriculture,which is of long-term significance.
2 Drawbacks analysis of traditional wireless sensor network
In traditional wireless sensor networks,now that wireless signal path is not an ideally barrier-free in most cases [Harrison,Seah and Rayudu (2016)],a signal of wireless nodes installed near the surface of the ground are often blocked by obstacles on the ground.If the terrain is not flat,even in situations of mountains,hills and other obstacles,the phenomenon of reflection,scattering and diffraction will frequently occur,and the attenuation of signal intensity will be significant [Zhen,Huang and Liang (2017)].It is mainly manifested in the reduction of amplitude and phase deviation of wireless signals.Because of signal attenuation,once the receiver acquires no sufficient information,information loss and even information errors will occur when a data packet is unpacked,resulting in insufficiency of data.Therefore,in order to ensure the integrity of data packets,it is necessary to re-transmit them until the received packets are complete [Li,Hu and Zhang (2018)].
Traditional static multi-hop network transmission mode is shown below in Fig.1.
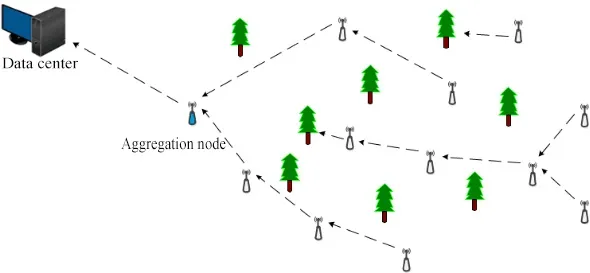
Figure1:Static multi-hop network transmission
RSSI value is usually observed when observing the signal intensity of wireless signals.The relationship between the power of the received signal intensity and the transmission length in non-free space is as follows:
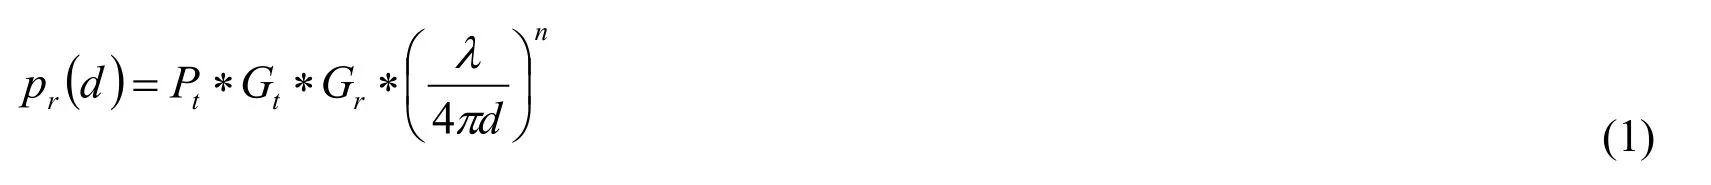
dis the distance between the signal transmission node and the receiving node,pr(d)is the receiving power of the signal when the distance isd,Ptis the signal transmission power [Lin,Miao,Zhang et al.(2016)],Gtis the antenna gain when the transmission,Gris the receiving antenna gain,andλis the signal wavelength of wireless signal.
Whenn=2the wireless signal transmission model is free space.Free space is not affected by blocks and obstacles,in which signal transmission is only direct without other ways such as reflection,refraction,diffraction,and scattering.Take the logarithm on both sides of formula (1)to get formula (2):

Similarly,the log power of the received signal when the transmission distance is d can be obtained:

The difference between formula (2)and (3)can be obtained:
The expression of (5)can be obtained if the upper part (4)is moved and sorted.
Ifd0=1m,then lg (d0)=0.10 l g (Pr(d0))is a constant associated with the environment.ForA=10 l g (Pr(d0)),RSSI(d)=10lg(Pr(d)),the following expression (6)is obtained:

Then,the upper form (6)represents the transmission model of wireless signals in nonfree space.From formula (6),it can be concluded that whend0=1mthe received powerAof RSSI under this condition is related to the environmental path loss indexn.At the same time,it can be seen that there is a linear fitting relationship between the received signal strength functionRSSI(d)and the distance logarithmic [Yigitler,Jantti and Patwari (2017)] functionlg(d).However,there are various obstacles in the actual transmission path,which leads to more loss in the transmission path,resulting in more attenuation of the received signal.If there is more than one receiver,then the amplitude,phase,and arrival time of the received signal are different among the receiving nodes.This leads to dynamic changes in parameters A and n.
Thus,the multipath effect of the signal leads to differences in A and n values.In a practical process,field measurement is carried out for different environments,and different environments are selected to measure the signal intensity [Benton and Mitchell(2011)].In the experiment,the wireless transmission distanced0=1m,the intensity value of the received signal was observed under this condition,and the environmental parameter n was calculated according to Eq.(6).In order to guarantee the objectivity of data and eliminate contingency,several measurements are made in the experiment,the average value of the calculated results is worked out.
In the experiment,two kinds of wireless signal transmission environment are selected to compare,one is the open environment,the other is the environment with obstacles[Zhang,Yang,Bai et al.(2017)].Place the nodes in the open environment and on the position 0.2 m away from the obstacles;take this as the origin,make a 25 m long straight line with 1 m as the step value.In the experiment,five nodes are labeled in turn,of which the first node is mobile,the others are fixed,and then at different distances,the remaining four nodes send packets to the first node [Ridder,Vandermarliere and Ryckebusch(2016)].After getting the measurement,the RSSI value is calculated and analyzed according to the above analysis,and then the average value of each calculation result is obtained.The data is shown in the following charts in Fig.2.and Fig.3.
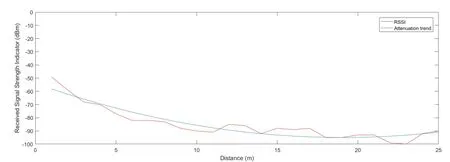
Figure3:RSSI average for different distances with obstacles
It can be seen that the variation trend of RSSI values is different under two conditions.When there are obstacles,the signal intensity is very low,because the straight path is basically blocked,and all the signals received are reflected,while the reflected signals have a long journey,and the signal intensity reaching this point will attenuate greatly.The signal attenuation in the open environment is normal.In order to compensate for the deviation of the system caused by the signal intensity,this design introduces UAV as the moving node to reduce the accuracy deviation caused by obstacles.
3 The experimental results
3.1 Measure on the central line of the building
Take two nodes,one at the sending node and the other as the receiving node,and the receiving node puts out ED value through the LCD module on the node.
A node (0 m away from the ground)is placed in the middle of the corridor,and its transmission power is set to 4 dBm.Then take this as the center,make a 25 m by 3 m rectangle,take 1 m as the step length,and record the ED value at 0 m (Fig.4),1 m (Fig.5),2 m (Fig.6)in each lattice of the square.After this step,the sending node is raised to 1 m and the experiment is repeated.The receiving node still needs to be measured at 0,1 and 2 m in height.The third step is to increase the sending node to 2 m.The transmission power is then raised to be slightly smaller than the maximum power and reduced to be slightly larger than the minimum power,and the above process is repeated.
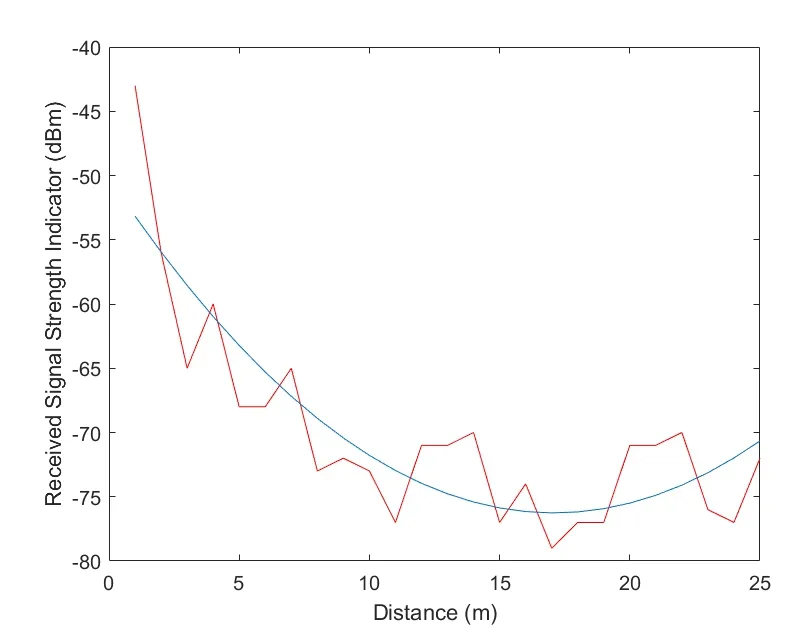
Figure4:Transmission and reception of signal intensity curves at the height of 0 m on the center line of the corridor
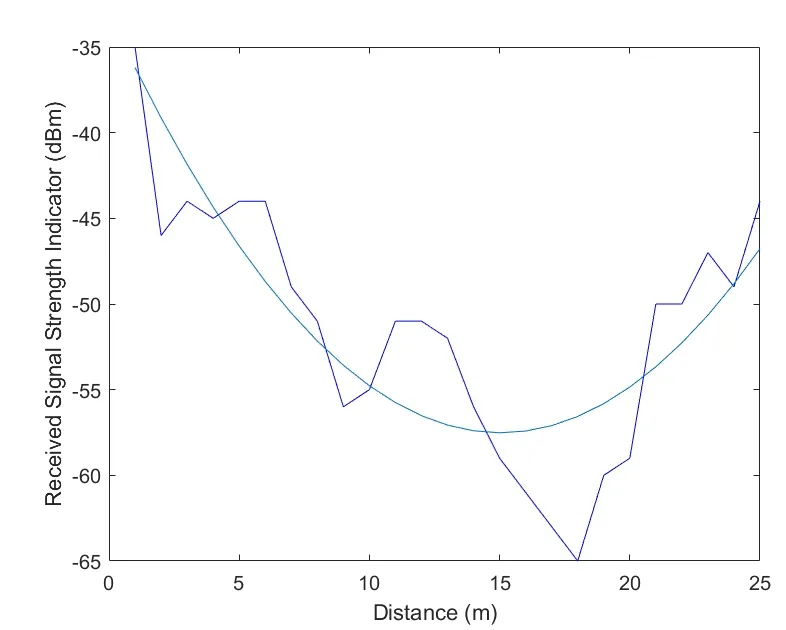
Figure5:Transmission and reception of signal intensity curves at the height of 1 m on the center line of the corridor
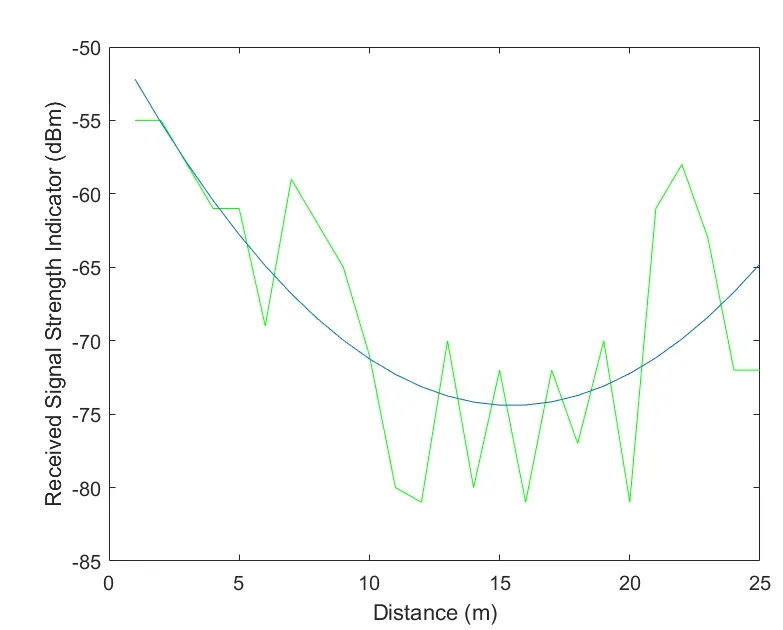
Figure6:Transmission and reception of signal intensity curves at the height of 2 m on the center line of the corridor
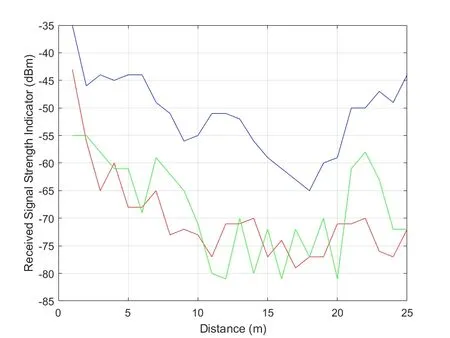
Figure7:Transmission and reception of signal intensity curves at the height of 0 m,1 m and 2 m on the center line of the corridor
3.2 Measure on the side of the corridor against the wall
The experiment is carried out by opening the node and optimizing experimental procedure.
(1)place a node (0 m from ground)in the center of the corridor,and the transmission power is set to 4 dBm
(2)take this as the origin and make a line with a length of 25 m,and take 1 m as the starting point and 1 m as the step length.Record the RSSI value with a height of 0 m on this line.
(3)raise the sending node to 1 m,repeat (2)and adjust the record height of the receiving node to 1 m.
(4)raise the sending node to 2 m,repeat (2),and adjust the record height of the receiving node to 2 m.
(5)repeat Steps 1~4 to place both the sending node and receiving node against the wall.
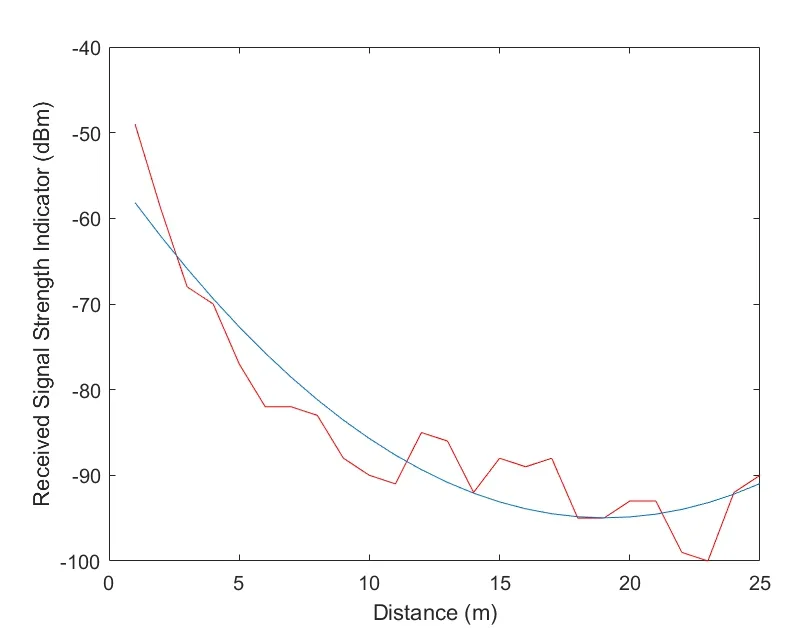
Figure8:The ED value of 0 m sending and receiving height meters
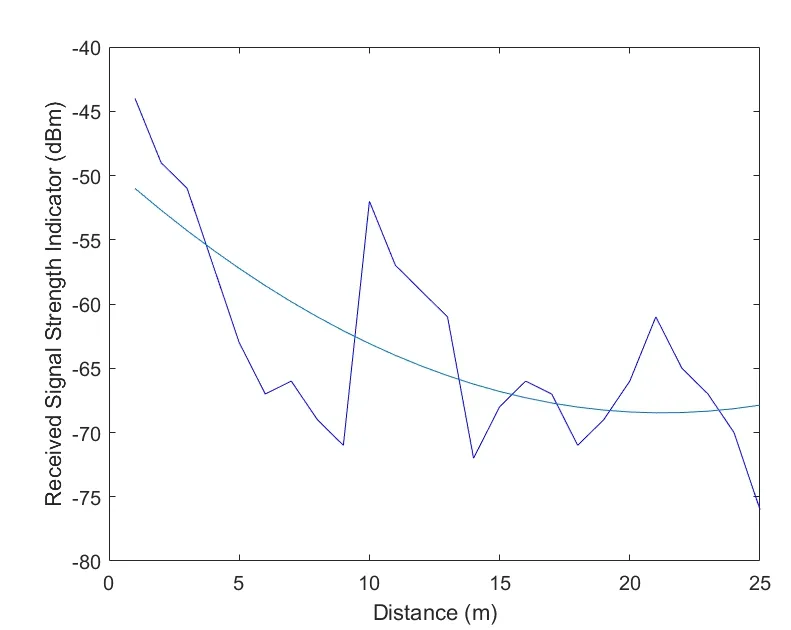
Figure9:The ED value of 1 m sending and receiving height
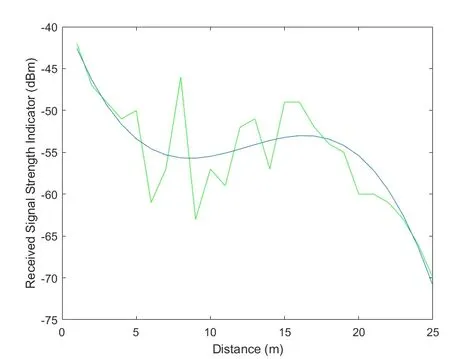
Figure10:The ED value of 2 m sending and receiving height
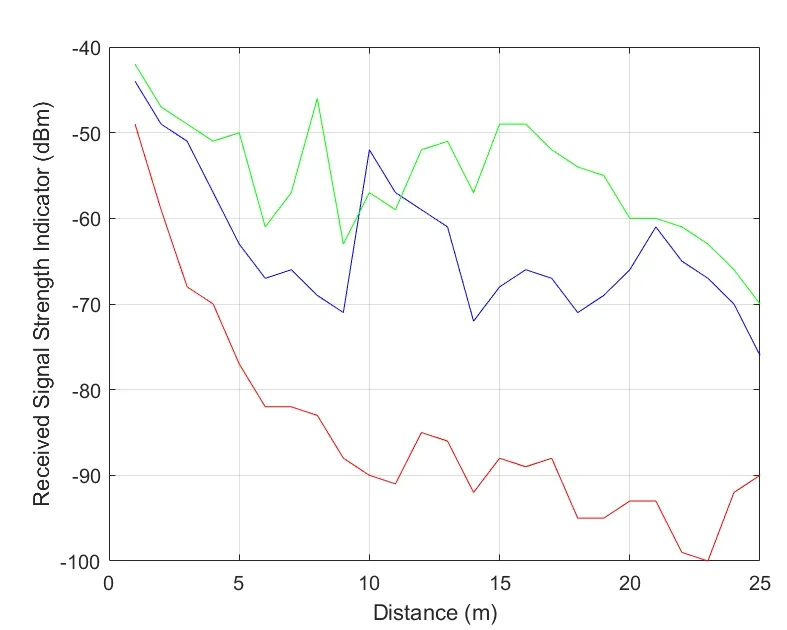
Figure11:The height of the sending and receiving is 0 m,1 m and 2 m when measured on the wall side of the corridor
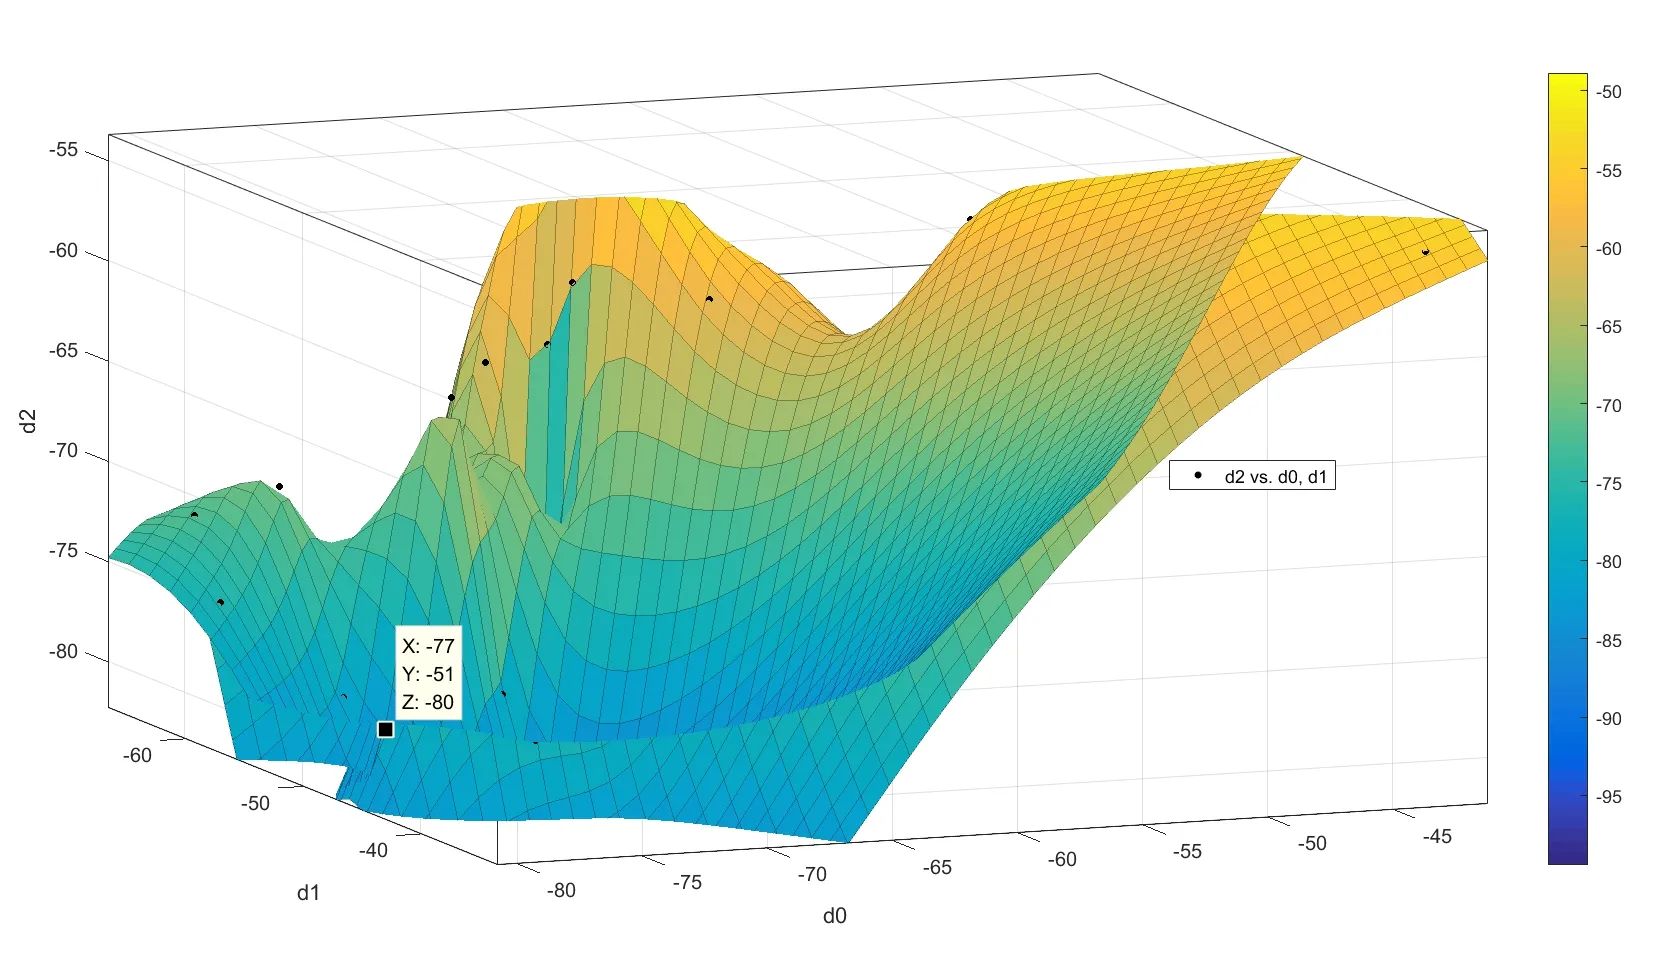
Figure12:Measure on the side of the building against the wall,with sending and receiving height of 2 m,is compared with 0 m and 1 m respectively
4 Design of UAV wireless sensor network
To overcome the shortcomings of traditional wireless sensor networks,this paper proposes a wireless sensor network for UAV [Qiu,Liu and Fu (2016)].The network system consists of three layers:perception layer,the transmission layer and the application layer.The perceptual layer is composed of various perceptrons and sensor nodes,which is the basic collector to information of cultivated land and crop growth,and achieves the information acquisition of various agricultural objects or the behavior of animals and plants [Xiang,Zhao and Li (2018)];the transmission layer transmits all kinds of information data from the perceptual layer by wired or wireless means.The application layer is for information processing [Saeedi,Sara and Liang (2017)],modeling and decision-making of the collected information to realize the management and control of the agricultural production process.The schematic diagram of the basic structure of the system is shown below in Fig.13:
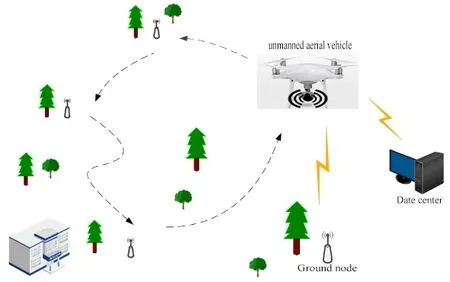
Figure13:System architecture diagram
5 Experimental results
This system has improved the traditional wireless sensor network structure.Aiming at the wireless sensor network of UAV mobile nodes,this study conducts ZigBee’s wireless communication loss rate experiment to verify the communication quality in different environments.In this experiment,the wireless sensor CC2530 is adopted [Wang,Ma,Yan et al.(2015)],and the antenna of the module is PCB,which is more convenient for impedance matching and of better signal gain than the spring external antenna.In this study,the packet loss rate experiment is carried out in different environments and different communication distances by utilizing the simple variable method.The packet loss rate and signal intensity of the CC2530 wireless communication packet are tested.In the experiment,the test program segment is added to the program of the child node [Veronica,Cecilia and Patricia (2017)],the fixed data packet is sent,and the verification program segment is added to the program of the mobile node.After receiving the data packet of the sending module,the integrity and correctness of the received data packet are verified in the program,and finally the loss rate of the communication packet is calculated.
The objective of this experiment is to test the packet loss rate,simplify the system model to eliminate the interference of other factors,extract the sending end and receiving end,and use the simple variable method to test the packet loss rate in the open environment and in the case of obstacles,as described below.
(1)barrier-free communication:UAV mobile node wireless sensor network is adopted,the communication channel is vertical barrier-free space,and the communication distance is increased by steps of 10 m [Sun,Boukerche and Wu (2017)].The vacant playground is chosen to simulate the free space environment for barrier-free communication,unmanned aerial vehicle (UAV)is equipped with a mobile node.First,fix the receiving end node,then raise up the unmanned aerial vehicle (UAV)in the vertical direction of the mobile node up to 10 m.With every 10 m higher,record the packet loss rate,until to a distance of 100 m.
In the test program,100 packets are sent each time,the number and correctness of received packets are observed in the verification program,and the packet loss rate of each communication is calculated.
Test data is shown as Fig.14:
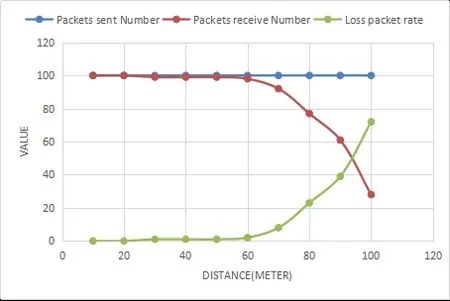
Figure14:Ground to air barrier-free communication
The results of ground-to-air barrier-free communication show that the quality of wireless communication does not change with the change of three-dimensional coordinates under barrier-free conditions,regardless of the coordinates of the receiver in this effective communication radius.Therefore,in the open environment,the quality of ground communication and ground air communication is similar.
(2)Ground-to-air communication with obstacles:wireless sensor networks using UAV mobile nodes,communication channels for vertical space with obstacles,communication distance to increase by 10 m as a step value.
The experiment first fixed the position of the terminal node and then moved the UAV with the mobile node from 10 m away from the terminal node in the vertical direction.Every 10 m distance was added to the test and record the packet loss rate once until the distance was 100 m.Set 100 packets per transmission in the test program,observe the number and correctness of received packets in the verification program and calculate the packet loss rate for each communication.The test data are as follows as Fig.15.
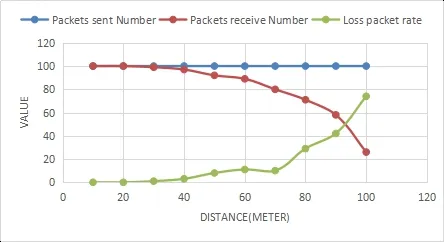
Figure15:Ground to air obstacle communication
In the case of channel obstruction,wireless sensor networks based on UAV mobile nodes have less packet loss rate and higher wireless communication quality than traditional wireless sensor networks.It can be seen that the ZigBee communication quality added to UAV has been greatly improved.
6 Conclusion
The key point of this system is that the transmission layer is no longer the traditional static one,but uses UAV as a mobile node to complete the task of the transmission layer,in order to overcome some shortcomings of the static transmission layer.The cultivated land monitoring system of UAV-WSN is studied and constructed.The traditional networking method is improved in a wireless sensor network with UAV as a mobile node.The distributed data storage and UAV are introduced to activate the working mechanism of the ground node and to solve the problem of signal intensity attenuation,phase deviation and high packet loss,which can greatly reduce the energy consumption of each node.
Acknowledgment:This research was financially supported by FDCT No.005/2018/A1,also supported by Youth Program No.GKY-2016KYQN-3 and No.GKY-2017KYQN-1,and College Students Innovation Training Program No.1611007 of Guangdong University of Science and Technology.
 Computers Materials&Continua2019年11期
- Computers Materials&Continua的其它文章
- Cryptanalysis and Improvement of a Chaotic Map-Control-Based and the Plain Image-Related Cryptosystem
- A Novel Robust Watermarking Algorithm for Encrypted Medical Image Based on DTCWT-DCT and Chaotic Map
- Measure-Resend Semi-Quantum Private Comparison Scheme Using GHZ Class States
- Texture Feature Extraction Method for Ground Nephogram Based on Contourlet and the Power Spectrum Analysis Algorithm
- A New Time-Aware Collaborative Filtering Intelligent Recommendation System
- Long Short Term Memory Networks Based Anomaly Detection for KPIs