
R/S ratio in lead ll, and the prognostic significance of red cell distribution width in acute coronary syndrome
2019-03-14 04:10:46AbuzerCokunSevkiHakanEren
World Journal of Clinical Cases 2019年16期
Abuzer Co?kun, Sevki Hakan Eren
Abstract
Key words: Acute coronary syndrome; Emergency department; R/S ratio; Red cell distribution width
INTRODUCTION
Coronary artery disease (CAD) includes a group of diseases that can have reduced incidence when risk factors are controlled.CAD is the leading cause of death in men and women.CAD increases with age, and affects people in their most productive years[1].CAD may lead to death from a clinically unclear disease.For this reason, early diagnosis and rapid planning of treatment are of great importance in CAD.Each 30-min delay between the onset of symptoms and reperfusion therapy increases mortality[2].Percutaneous coronary intervention is a method of revascularization that can be applied in patients with acute coronary syndrome (ACS).It has a positive effect on mortality reduction in high-risk patients[3].
While the electrical axis is calculated on a healthy human electrocardiogram (ECG),the left ventricle is three times larger than the right ventricle.A depolarization waveform that mainly moves backward and to the left is seen on the electrocardiography tracing, and large R waves consequently take shape in leads I, II,III and aVF[4].Right ventricular mass is more dominant than left ventricular mass in the right heart growth.Due to the right ventricle being more dominant, the depolarization wave moves forward and to the right in the ECG tracing.As a result,deep S waves are observed in leads I, II, III and aVF[5].Additionally, the average electrical axis can be changed in the intraventricular conduction system blocks[6].
There are many studies that can give early warning for CAD, with the exception of cardiac troponins (cTn).One of them is the erythrocyte distribution width (RDW), and a measure of the heterogeneity of circulating erythrocytes.There is a strong relationship between CAD and high RDW, but the underlying mechanism is still unclear.In the studies conducted, the neurohumoral system is activated in people with CAD and heart failure.As the mediators increase in circulation, the erythropoiesis process is accelerated, and the RDW is eventually increased[7-9].
In previous studies, we have investigated the relationship between ACS, RDW and cTns, but we have not been able to detect a study based on lead II derivation in the literature according to the R to S ratio (RSR) > 1 and RSR < 1.In our study, we aimed to evaluate ST-elevation myocardial infarction (STEMI) subgroups [acute inferior myocardial infarction (AIMI), acute anterior myocardial infarction (AAMI)], non-STEMI (NSTEMI) and high-risk unstable angina (UA) groups; in terms of RSR, cTn I,complications following acute myocardial infarction (AMI), three-vessel disease(TVD) and mortality.
MATERIALS AND METHODS
Study design and population
We retrospectively obtained the results of 1296 patients (466 females, 830 males, mean age 61.56 ± 9.42 years; distribution 26-82 years) who presented to the emergency department (ED) between January 2014 and December 2018 for chest pain, and were admitted to the Cardiology Clinic with the pre-diagnosis of ACS.The patients excluded from the study included those whose biochemistry and hemograms were not studied, 12-lead ECG was not performed during the ED, angiographies and echocardiographies were not performed after hospitalization, and in whom sepsis and septic shock, pulmonary thromboembolism, pericarditis and myocarditis, blunt chest traumas, all malignancy types, chronic kidney failure, cerebrovascular diseases, toxic hepatitis, chronic liver diseases, and cTn were not examined.
The patients were high-risk UA patients according to the AIMI, AAMI, and NSTEMI group, which are the subgroups of STEMI, and the Braunwald classification[10].AIMI, inferolateral MI, inferoposterior MI, posterior MI, and right ventricular MI were evaluated in the AIMI subgroup; septal MI, anterior MI, lateral MI, high lateral MI, and diffuse anterior wall MI were evaluated in the AAMI subgroup.The patients were referred to group I for RSRs less than one, and to group II for RSRs greater than one in the lead II.These groups were compared in terms of age, gender, cTn I, TVD, gensini score, and mortality.cTn Is were recorded as troponin I, II, III by being repeated at the 0th, 6th, and 12thh after admission to the ED.
The patients who had chest pain and/or discomfort lasting at least 30 min, and ECG with STEMI according to 2013 ACCF/AHA guidelines, were included in the study[11].UA/NSTEMI is defined according to the criteria of the 2014 AHA/ACC Guideline for the Management of Patients With NSTE-ACS.All of the patients were checked with Transthoracic Echocardiography (TTE) to look for whether focal wall motion abnormalities were present.A Philips Epiq 7 Ultrasound Machine was used for TTE in this study.
The demographic, clinical, and laboratory data from the date of presenting to the ED due to ACS, including the RSR and cTn I levels, were assessed by reviewing the hospital’s medical records.
Hemogram was measured using a Beckman Coulter Automated CBC Analyzer(Beckman Coulter, Inc., Fullerton, CA, United States).
Blood was analysed with the Cobas 6000 (C6000-Core, Cobas c-501 series, Hitachi,Roche, United States).The hemogram and biochemistry results were studied between 45-60 min.
Cardiac biomarker analysis
Venous blood samples from the antecubital veins of patients were obtained to measure the serum levels of cTn I.cTn I, STAT Elecsys and Cobas e 411 Hitachi Roche analysers were used to measure cTn I levels.The cTn I levels of patients were measured at the 0th, 6thand 12thh.
Electrocardiography
Twelve-lead ECG was performed at the bedside with Cardiofax ECG-9132K (Nihon Kohden, Tokyo, Japan) when the patient was admitted to the ED.
Angiographic analysis
Angiographic evaluations were performed by two experienced cardiologists who were blinded to the study.Discrepancies were solved by consensus.The extent and severity of CAD were assessed by the gensini score[12].
Gensini scoring system
The gensini score was calculated by multiplying the severity coefficient, which was assigned to each coronary stenosis according to the degree of luminal narrowing(reductions of 25%, 50%, 75% 90%, 99%, and complete occlusion were given gensini scores of 1, 2, 4, 8, 16, and 32, respectively), by the coefficient identified based on the functional importance of the myocardial area supplied by that segment:The left main coronary artery, 5; the proximal segment of the left anterior descending coronary artery, 2.5; the mid segment of the left anterior descending coronary artery, 1.5; the apical segment of the left anterior descending coronary artery, 1; the first diagonal branch, 1; the second diagonal branch, 0.5; the proximal segment of the circumflex artery, 2.5 (if right coronary artery dominancy exists, 3.5); the distal segment of the circumflex artery, 1 (if dominant, 2); the obtuse marginal branch, 1; the posterolateral branch, 0.5; the proximal segment of the right coronary artery, 1; the mid segment of the right coronary artery, 1; the distal segment of the right coronary artery, 1; and the posterior descending artery, 1[12].
All patients were given written informed consent, and the study was approved by the Ethics Committee of the Cumhuriyet University, Faculty of Medicine.
The study was conducted by following the Declaration of Helsinki for Human Research, and was approved by the institutional review board.
Statistical analysis
The data obtained from this study were analysed using the SPSS 15.0 (SPSS, Inc,Chicago, IL) software package.The Shapiro-Wilk's test was used while analysing the normal distribution of the variables based on their unit numbers.While analysing the differences between groups, the independent samplest-test was used for the normally distributed variables, while the Mann WhitneyUand Kruskal Wallis-H tests were used for the non-normally distributed variables.In the case of significant differences in the Kruskal Wallis-H test, the groups with differences were determined by using the Post-Hoc Multiple Comparison Test.Theχ2analysis was carried out while analysing the correlations between the groups of nominal variables.The Fisher's Exact Test was used when the expected values in the cells of the 2 × 2 tables did not have sufficient volume, and Spearman correlation analysis was carried out in the R × C tables with the help of Monte Carlo Simulation.We used univariate analysis to quantify the association of variables with the development of RSR.The variables found to be statistically significant in the univariate analysis were used in a multivariate Cox proportional hazards model with forwarding stepwise method to determine the independent prognostic factor for the development of RSR.In addition,the Friedman's two-way ANOVA test was used for the data with regard to the time difference between groups.A significance level of 0.05 was used while interpreting the results;Pvalues less than 0.05 were considered as statistically significant.
RESULTS
The clinical and demographic characteristics of the patients are listed in (Table 1).
In the chi-square analysis with the variables according to the RSR groups of ACS,UA, NSTEMI, and STEMI were more common in group I for both males and females.AIMI was more common in group II, and AAMI was more common in group I.However, TVD and mortality were more common and statistically significant in group II (P< 0.05, Table 2).
In the chi-square analysis of ACS groups according to the variables, ischemic heart failure, ventricular tachycardia, and acute pulmonary oedema were more common in AAMI.Atrioventricular block was more common in AIMI.TVD and mortality were observed to be more common in AAMI (P< 0.05, Table 3).
In the chi-square analysis of ACS, according to the blocked major coronary artery in terms of complications, ischemic heart failure and ventricular tachycardia were most commonly detected in the left anterior descending (LAD = L2), atrioventricular block was most commonly detected in the right coronary artery, pericardial effusion and cardiac tamponade were most commonly detected in the LAD, and acute pulmonary oedema was most commonly detected in the circumflex artery.TVD and mortality were most commonly found in the LAD (P< 0.05, Table 4).RDW; STEMI, NSTEMI,TVD, post-AMI complications and group I were high.
The univariate and multivariate Cox regression analysis of the variables between the RSR groups were statistically significant (P< 0.05, Table 5).
DISCUSSION
In the literature, Davieset al[13]1959 and Evanset al[14]1966 looked to the mortality and prognosis effects of S on leads II and III.B?ret al[15]tried to determine the prognosis of RSR on leads V1 and V2 in 1984.However, we have not been able to detect a study with RSR in the literature based on lead II derivation.On applications for the Emergency Service Department, we aimed to correlate the RSR groups on lead II derivation with TVD, mortality and the complications that may occur after ACS.
Lead II derivation includes both blocks and non-block R and S waves.Also, lead II derivation is the potential difference between right arm and left leg that is showed on ECG.Lead II is equal to the total voltage of leads I and III.For this reason, it has thefeature of being the clearest seen derivation on all ECG waves.It is used to evaluate atrial and ventricular hypertrophies in the diagnosis of cardiac rhythm and pathology.It shows lower wall ischemia and possible circumflex artery lesions in coronary ischemic pathologies.For these reasons, we preferred lead II derivation in our study.

Table 1 Baseline characteristics of acute coronary syndrome study patients
In patients with ACS, it is possible to identify patients who are at risk with serial troponin measurements.It has been shown that the risk of cardiac complications has a high prognostic value in patients with high levels of cardiac troponin.cTns have an important role in the diagnosis, prognosis and treatment of ACS.CTn is important in separating UA from NSTEMI, and verifying the diagnosis.High cTn I values are important in the diagnosis of UA for patients with ACS who have cardiac risk and whose CK-MB levels are normal[16-18].In the TIMI 18 study, patients with a cTn I level higher than the 99thpercentile had a three-fold higher risk of having a MI or erythrocyte MI than those with a cTn I level of < 0.1 ng/mL[19].Jameset al[20]reported that in 7,115 patients diagnosed with NSTEMI-ACS, the risk of mortality was low in patients with cTn-T levels < 0.01 μg /L.
In our study, cTn I values in groups 2, 6, and 12 were significantly higher than in group 1.The number of cases was low, but the gensini score indicating the prevalence of coronary artery was high.As a result, three vessel disease was common, and the left ventricular ejection fraction was low.As a result, in group II, high cTn I, post-AMI complications, TVD, prognosis and mortality were higher.The values in group II were at the highest level in the AIMI and AAMI subgroups, but lower in the NSTEMI group, and less in UA with less inflammation.In group I, three vessel disease was low, and the result was a low gensini score, and thus the left ventricular ejection fraction was high.Patients’ clinical, prognosis and mortality were better than group II.These variables were evaluated in univariate regression analyses, and it was found to be significant after multivariate regression analyses.In addition, cTnI, AMI postoperative complications, TVD and mortality correlations were positivelycorrelated.It is important to determine low troponin values and small increases in these levels accurately and consistently.We are of the opinion that it is extremely useful to determine the critical threshold level for follow-up and treatment in the diagnosis and prognosis of patients with ACS.
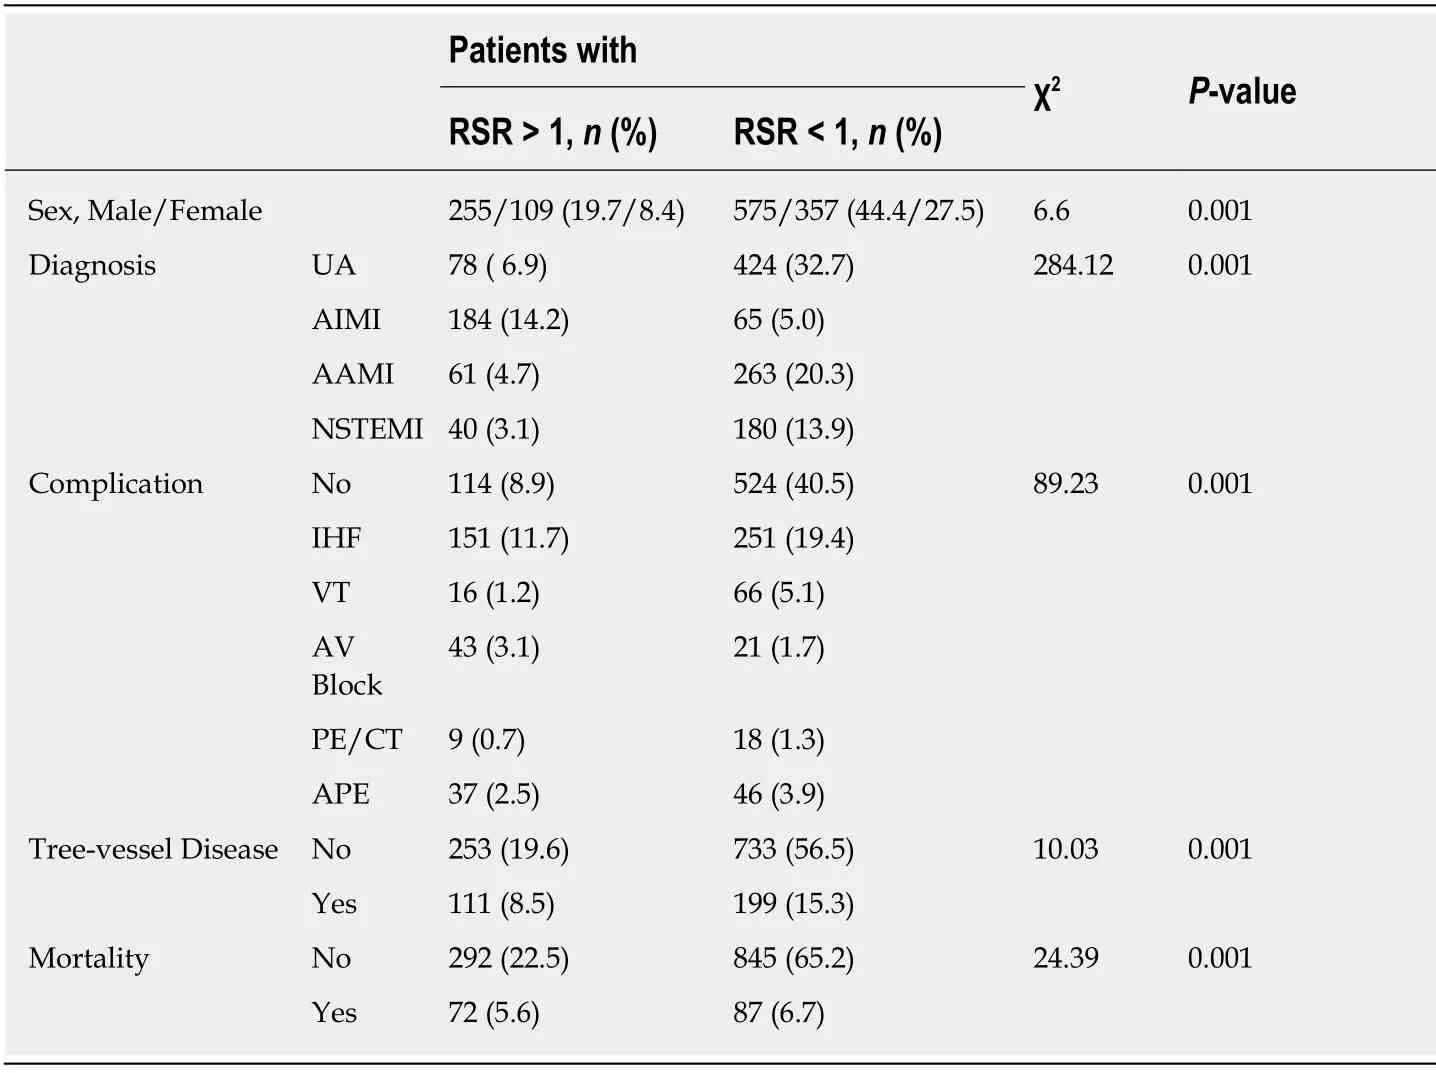
Table 2 χ2 analysis of acute coronary syndrome according to R to S ratio variables
Although it is known that there is a relationship between CAD and RDW, the underlying pathophysiological mechanism is still unclear.The first of the pathophysiological mechanisms suggested that inflammation, which has an important role in the atherosclerotic process, causes the release of cytokines into the circulation and increases RDW levels[21-23].Secondly, mediators resulting from increased neurohumoral activity during ACS stimulate erythropoiesis and increase RDW levels[24].They found that RDW is an independent risk factor for hospital and longterm mortality in patients with ACS[25-27].Warwicket al[27]also emphasized that RDW is an important risk in long-term mortality in patients undergoing coronary artery bypass surgery.In their study, Lippiet al[28]suggested that high RDW should be used together with cardiac markers in patients admitted to the ED.Tenekeciogluet al[29]found that RDW was higher in patients diagnosed with NSTEMI than patients diagnosed with UA.They showed that RDW showed a positive correlation with cTn I.Therefore, they suggested that RDW could be a useful parameter in the ED.
In our study, we found a close relationship between ACS and RDW.We found that high RDW values may be an independent marker of ACS with positive troponin.RDW can be used both as a guide in the diagnosis of ACS and in prognosis.In addition, RDW was associated with morbidity and mortality in acute heart failure,CAD and AMI.In group II, RDW values were highest in the STEMI group, followed by UA following NSTEMI.In addition, complications after AMI were significantly higher in TVD and mortality.In group I, these values were lower than group II.RDW was strongly correlated with univariete and multivariate regression analysis,mortality, TVD and RSR groups.Therefore, patients with asymptomatic atherosclerosis, and therefore with high RDW levels prior to ACS, may experience faster myocardial damage and increased troponin exposure to AMI.We think that it is a useful parameter that can be used with RDW and cTn in patients admitted to the emergency room due to CAD and ACS.
In this study, we found that cTn I, GS, LVEF, TVD and mortality levels increased in patients with ACS according to RSR > 1 and < 1 in leads II.We found that the level of cardiac troponin is higher in cases where myocardial involvement like UA is less than the other groups and STEMI, and that the level of cTn I is higher than in NSTEMI.In group II, cTn I values in CAD patients correlate with the degree of myocardial involvement, and suggest that it increases due to inflammatory events occurringduring AMI.The number of cases in group II was poor.RDW, mortality, TVD, AIMI and GS were high in this group.Although the number of cases in group I was high,the number of complications was low, and the prognosis was good because GS was lower and LVEF was higher.

Table 3 χ2 analysis of acute coronary syndrome according to diagnostic variables
Study limitation
The most important constraints were the retrospective nature of the study, the strengths to reach the results, and the single-centre study.Additionally, we could not access the drug use history, secondary life and CAD risk factors that may affect the prognosis of patients.The main limitation was that ECG and cTn data could not be reached again after admission to ED and hospitalization.
CONCLUSION
We think that RSR and high RDW levels may be a prognostic factor in terms of complications after AMI, such as cTn I, TVD and mortality, and that RSR effects in ACS patients are an open subject to research.

Table 4 χ2 analysis of acute coronary syndrome according to blocked major coronary artery variables

Table 5 Univariate and multivariate Cox regression analyses for predicting the development of R to S ratio
ARTICLE HIGHLIGHTS
Research background
New cardiac biomarkers and techniques that will help to provide rapid diagnosis are needed in order to evaluate risk in coronary artery patients.
Research motivation
The aim of this study was to evaluate the significance of R/S ratio (RSR) in the lead II derivation of electrocardiography in acute coronary syndromes (ACS) patients, in regard to the complications associated with myocardial infarction, three-vessel coronary artery disease, and mortality.
Research objectives
If the research is supported by prospective studies, it may be a guide for patients with ACS in the future.
Research methods
Between January 2014 and December 2018, 1,296 patients with ACS were included in the study.The patients were referred to group I for an RSR value less than I, and to group II for an RSR value greater than I.
Research results
In our study, 466 (35.9%) of the 1,296 patients (357 (38.3%) in group I and 109 (29.9%) in group II)were female, with a mean age of 61.56 ± 9.42.ST-elevation MI 573 (44.2%), unstable angina (UA)502 (38.7%) and non-ST-elevation MI 220 (17%) were more prevalent in group I.In group 1, acute anterior MI 263 (20.3), and in group II acute inferior MI 184 (14.2) was higher.Ischemic heart failure was the most common complication.In group II, the red cell distribution width (RDW)was 15.42 ± 1.82, the gensini score was 48.39 ± 36.44, the left ventricular ejection fraction was 41.17 ± 10.41, the three-vessel disease (TVD) was 111 (8.5), and the mortality rate was 72 (5.6),which was significantly higher than group I RDW; in MI with ST and non ST-elevation, in TVD,mortality and complications was high and was low in UA.In single and multivariate regression analyses, the variables were associated with ACS risk.
Research conclusions
RSR levels may be an auxiliary predictive value in ACS in terms of complications developing after myocardial infarction, TVD, and mortality.
Research perspectives
R/S ratio, red cell distribution width.
 World Journal of Clinical Cases2019年16期
- World Journal of Clinical Cases的其它文章
- Malignant syphilis accompanied with neurosyphilis in a malnourished patient:A case report
- Ex vivo revascularization of renal artery aneurysms in a patient with solitary kidney:A case report
- Pseudothrombus deposition accompanied with minimal change nephrotic syndrome and chronic kidney disease in a patient with Waldenstr?m's macroglobulinemia:A case report
- Hepatocellular carcinoma successfully treated with ALPPS and apatinib:A case report
- Treatment of invasive fungal disease:A case report
- Acute pancreatitis connected with hypercalcemia crisis in hyperparathyroidism:A case report