
URANS simulations of the tip-leakage cavitating flow with verification and validation procedures *
2018-07-06 10:02:00HuaiyuCheng程懷玉XinpingLong龍新平YunzhiLiang梁蘊(yùn)致YunLong龍?jiān)?/span>BinJi季斌
水動力學(xué)研究與進(jìn)展 B輯 2018年3期
Huai-yu Cheng (程懷玉), Xin-ping Long (龍新平), Yun-zhi Liang (梁蘊(yùn)致), Yun Long (龍?jiān)?,Bin Ji (季斌)
1. State Key LaboratoryofWaterResourcesandHydropowerEngineeringScience,SchoolofPowerand Mechanical Engineering, Wuhan University, Wuhan 430072, China
2. Hubei Key Laboratory of Waterjet Theory and New Technology, Wuhan University, Wuhan 430072, China
3. Science and Technology on Water Jet Propulsion Laboratory, Shanghai 200011, China
The cavitation induced by the low pressure in the core of the tip-leakage vortex (TLV) is prevalent in axial hydraulic machines[1], which is often accompanied with vibration, instability and performance loss[2-6]. Therefore, a better understanding of this unsteady multiphase flow phenomenon is urgently needed.
In the past decades, many experimental investigations were conducted to obtain an insight on the behaviors of the TLV[7-9]. Lakshminarayana et al.[10]measured the components of the relative velocity in the tip region of an axial flow compressor. Recently, a series of PIV measurements and flow visualizations for the tip-leakage cavitating flow were conducted by Dreyer et al.[11]The structure and the trajectory of a TLV induced by a NACA0009 hydrofoil of different confinements and flow parameters were measured and investigated in detail. The experimental data indicated that the trajectory and the intensity of the TLV were significantly influenced by the wall proximity. At the same time, quite a number of numerical simulations were also conducted. You et al.[12]numerically studied the incompressible flow in a rotor-tip clearance and pointed out that the velocity gradients in the vicinity of the gap were responsible for the viscous losses in the gap. Based on the numerical results, Guo et al.[13]analyzed the influence of various gap widths on the evolution of the TLV and suggested that the tipseparation vortex (TSV) induced by the flow separation might affect both TLV’s shape and intensity.Wang et al.[14]reviewed the numerical models of various cavitating flows around hydrofoils and discussed the TLV cavitation in detail. With a non-linear turbulence model, the tip-leakage flow around a NACA0009 foil with various gap sizes was simulated.They suggested that it was an important but challenging task to predict the TLV cavitation with a high accuracy. The remarkable progress of the TLV cavitation suggests that the numerical simulation is a promising method in studying the TLV cavitation.However, little attention was paid on the verification and validation (V&V) of the numerical results[15,16],especially for the cavitation simulations. Long et al.[17]studied the feasibility of seven uncertainty estimators in the simulations of the cavitating flow around a Clark-Y hydrofoil and suggested that the factor of safety (FS) and its modified version (FS1) and grid convergence index (GCI) showed a better feasibility and applicability to be used for the cavitating flow around a hydrofoil. Their work also indicated the importance of the V&V in a numerical investigation of cavitation. However, due to the special flow characteristics of the TLV cavitation, the V&V investigations of the tip-leakage cavitating flow were few.
Inspired by the previous studies, the present paper investigates the TLV cavitation numerically with the SST-CC turbulence model and the VIZGB cavitation model[18].The numerical results are compared with the available experimental data[11]and checked carefully using the V&V procedures. The feasibility and the applicability of seven uncertainty estimators, including the correction factor (CF)method, the FS and the FS1, the GCI and its modified versions (the GCI-OR, the GCI-LN, and the GCI-R)in the simulation of the TLV cavitation are studied in the quantitative evaluations of the numerical errors.Finally, with the numerical results, the influence of the cavitation on the behaviors of the TLV is discussed.
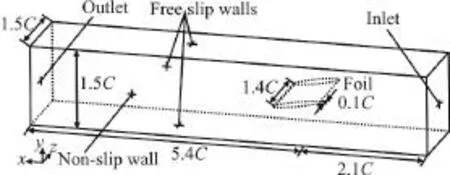
Fig. 1 Computational domain and boundary conditions
Figure 1 shows the computational domain and the boundary conditions.C= 0.1m is the chord of the hydrofoil. The gap size is set as 0.1Cand the attack angle α is 10°. The inlet static pressure is 105Pa and the outlet velocity is set to 10 m/s. Three sets of systematically refined meshes are generated with the same topology and the constant refinement ratio of. Detailed parameters of these meshes are listed in Table 1. Figure 2 shows a typical configuration of the computational mesh around the hydrofoil. For these meshes, the first layer thickness around the foil is set as a constant. The cavitation simulations are initialized from the steady state results using fully wetted models with the SST-CC turbulence model. The VIZGB model combined with the unsteady solver is then switched on for the unsteady cavitation flow simulations.
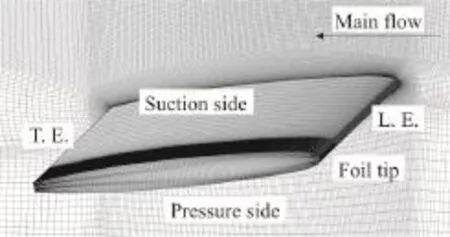
Fig. 2 Typical configuration of the computational mesh around hydrofoil
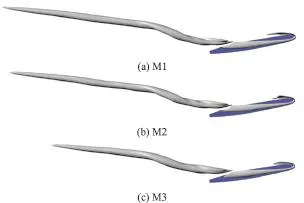
Fig. 3 (Color online) Time-averaged predicted TLV cavitations with M1-M3
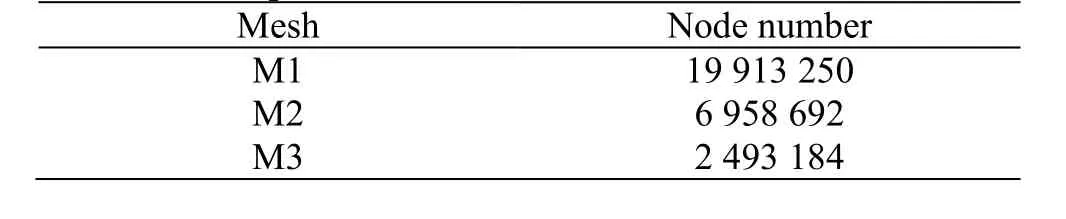
Table 1 Mesh parameters
In the present paper, qualitative comparisons between the numerical results and the experimental data are made. Figure 3 shows the time-averaged TLV cavitation (iso-surface ofvα with the value of 0.1)predicted with M1-M3, in which the influence of the mesh resolution on the numerical results can be observed clearly. For M1, M2, with a quite fine resolution in the vicinity of the gap, the development of the TLV cavitation is well predicted. The length of the predicted TLV cavitation is much shorter with M3. The reasonable agreement between the predicted TLV cavitation with M1, M2 suggests that M2 is sufficient to capture the characteristics of the tipleakage cavitating flow and a further refinement is not necessary. Figure 4 shows the distributions of the time-averaged streamwise velocity on the measured plane, / =1x C, in which the numerical results are obtained with M2. Moreover, the numerical result of Guo et al.[18]is also shown. Although the streamwise velocity in the core of the TLV obtained with M2 is underestimated slightly, mainly due to the lack of the SST-CC model, the location of the TLV core is predicted better than the result of Guo et al.[18]. The TLV cavitation predicted with M2 (displayed by the iso-surface ofvα with the value of 0.1) is compared with the experimental picture[11]in Fig. 5. A quite good agreement between the numerical and experimental results is obtained. The satisfactory agreement between the numerical and experimental results suggests that the numerical data obtained with M2 enjoy a reasonable accuracy.
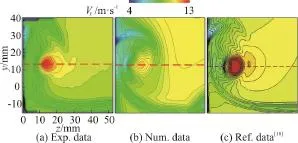
Fig. 4 (Color online) Comparison of distributions of timeaveraged streamwise velocity
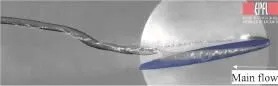
Fig. 5 (Color online) Comparison of the time-averaged numerical and experimental TLV cavitations
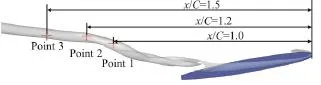
Fig. 6 (Color online) Locations of monitoring points
It should be noted that the comparisons between numerical and experimental results conducted above are just qualitative. Therefore, the V&V procedures are utilized to provide a quantitative error estimation of the numerical results obtained with M2. In the following discussion, the time-averaged dimensionless velocityVand pressurePat three monitoring points(see Fig. 6) obtained with M1-M3 are used for the V&V procedures. All time-averaged data are obtained after at least 10 000 time steps, which is sufficient for a statistical analysis in the current case. As mentioned above, the feasibility and the applicability of uncertainty estimators are still an open question for the TLV cavitation simulation. Therefore, in the present paper,all seven uncertainty estimators are used to estimate the numerical errors comprehensively. A detailed introduction of these uncertainty estimators can be found in the publication by Long et al.[17], Xing and Stern[15]. Table 2 shows the uncertainty of the time-averaged velocity and pressure at three monitoring points, in which13-VVand13-PPrepresent the uncertainty of the time-averaged velocity and pressure at Point 1-Point 3, respectively. It can be found that the uncertainty estimated by most of these methods is quite low, except FS1, one of the modified version of FS. It suggests that the influence of the mesh resolution on the numerical results is not so apparent and a further refinement for M2 is not necessary. Table 3 shows the numerical errors and the total uncertainty of the velocity at the monitoring points, in which13-EErepresent the difference between the numerical and experimental results.Uv1-Uv3represent the total uncertainty, which consists of two parts of uncertainty, the numerical uncertainty listed in Table 2 and the experimental uncertainty. In the current paper, the experimental uncertainty of the time-averaged velocity is estimated as 2.5% of the inlet velocity[11]. It should be noted that because the measured pressure data are not available,only the numerical errors and the total uncertainty of the time-averaged velocity at the monitoring points are listed in Table 3. According to Long et al.[17]and Xing and Stern[15], the validation is achieved at theTable 3 shows that the validation can be achieved only at Point 2 and Point 3 with FS1,at the level of 0.3206 and 0.5913, respectively. The lack of the SST-CC model, which is a kind of RANS model essentially, should be responsible for that problem. Although the location of the vortex core is well predicted by the SST-CC model, the velocity in the vortex core is underestimated, which induces great numerical errors and further prevents the validation.
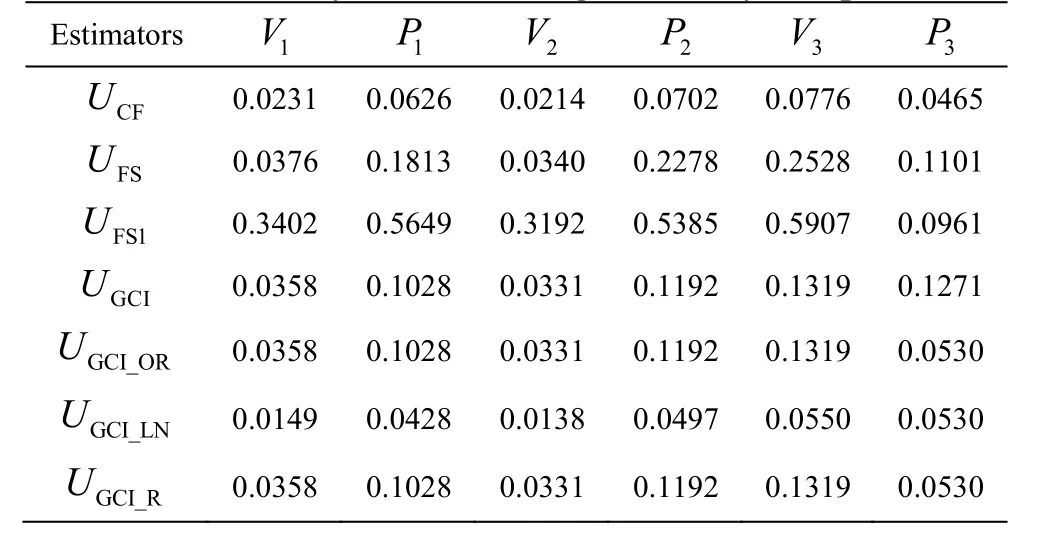
Table 2 Uncertainty of time-averaged velocity and pressure
Overall, the numerical results obtained with M2 provide a satisfactory prediction of the gross characteristics of the TLV cavitation with a reasonable accuracy and a further mesh refinement cannot reduce the numerical errors significantly due to the lack of the RANS model, but might induce a huge increase of the cost of the computational resources. Therefore,M2 is a good choice for a RANS simulation with a balance between accuracy and computational cost,especially for the investigation of the TLV trajectory.
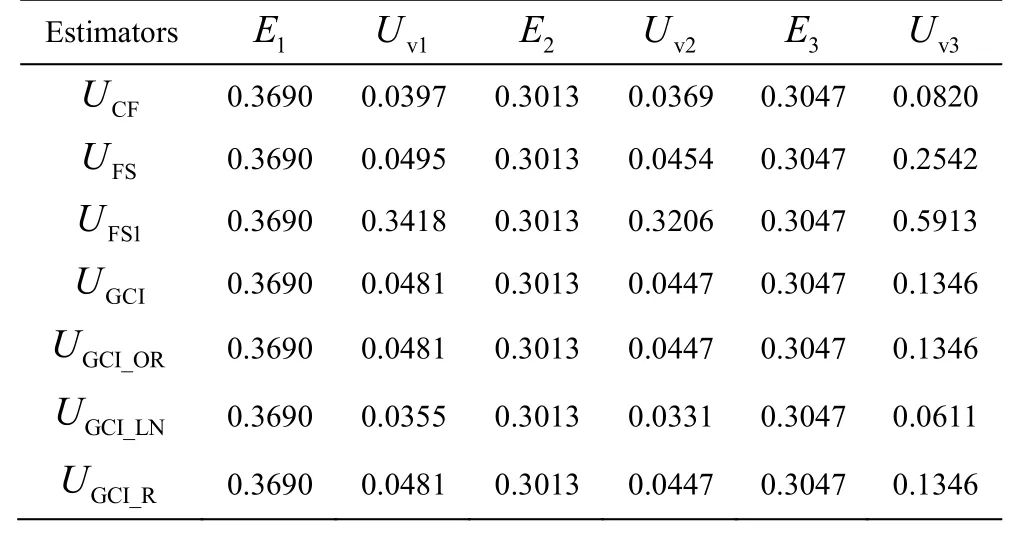
Table 3 Numerical errors and total uncertainty of velocity
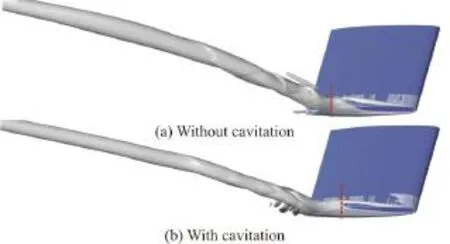
Fig. 7 (Color online) Influence of cavitation on the fusion of TLV and TSV
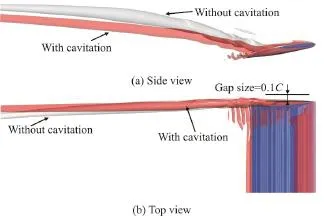
Fig. 8 (Color online) Influence of cavitation on TLV trajectory
Cavitation will influence the behavior of TLV. In Fig. 7, the fusion locations of the TLV and the TSV in both cases are marked, which indicates that cavitation tends to accelerate the fusion of the TLV and the TSV slightly. It can be attributed to the narrower passageway in the case with cavitation, leading to a higher velocity component from the pressure side to the suction side, as is favorable to the fusion of the TLV and the TSV. Figure 8 further reveals the influence of the cavitation on the TLV trajectory. Compared with the case of the non-cavitating flow, the TLV trajectory in the case with cavitation sees a lower pitchwise location and is closer to the gap wall, which may induce a more serious cavitation erosion.
[1] You D., Wang M., Mittal R. A methodology for high performance computation of fully inhomogeneous turbulent flows [J].International Journal for Numerical Methods in Fluids, 2007, 53(6): 947-968.
[2] Wang Y., Xu C., Wu X. et al. Ventilated cloud cavitating flow around a blunt body close to the free surface [J].Physical Review Fluids, 2017, 2(8): 084303.
[3] Wu Q., Huang B., Wang G. et al. The transient characteristics of cloud cavitating flow over a flexible hydrofoil [J].International Journal of Multiphase Flow, 2018, 99:162-173.
[4] Long X., Cheng H., Ji B. et al. Large eddy simulation and Euler–Lagrangian coupling investigation of the transient cavitating turbulent flow around a twisted hydrofoil [J].International Journal of Multiphase Flow, 2018, 100:41-56.
[5] Cui P., Zhang A. M., Wang S. P. et al. Ice breaking by a collapsing bubble [J].Journal of Fluid Mechanics, 2018,841: 287-309.
[6] Roussopoulos K., Monkewitz P. A. Measurements of tip vortex characteristics and the effect of an anti-cavitation lip on a model Kaplan turbine blade [J].Flow Turbulence and Combustion, 2000, 64(2): 119-144.
[7] Goto A. Three-dimensional flow and mixing in an axialflow compressor with different rotor tip clearances [J].Journal of Turbomachinery, 1992, 114(3): 675-685.
[8] Farrell K. J., Billet M. L. A correlation of leakage vortex cavitation in axial-flow pumps [J].Journal of Fluids Engineering, 1994, 116(3): 551-557.
[9] Miorini R. L., Wu H., Katz J. The internal structure of the tip leakage vortex within the rotor of an axial waterjet pump [J].Journal of Turbomachinery, 2012, 134(3):031018.
[10] Lakshminarayana B., Zaccaria M., Marathe B. The structure of tip clearance flow in axial-flow compressors [J].Journal of Turbomachinery, 1995, 117(3): 336-347.
[11] Dreyer M., Decaix J., Munch-Alligne C. et al. Mind the gap: A new insight into the tip leakage vortex using stereo-PIV [J].Experiments in Fluids, 2014, 55(11): 1849.[12] You D., Wang M., Moin P. et al. Effects of tip-gap size on the tip-leakage flow in a turbomachinery cascade [J].Physics of Fluids, 2006, 18(10): 105102.
[13] Guo Q., Zhou L., Wang Z. Numerical evaluation of the clearance geometries effect on the flow field and performance of a hydrofoil [J].Renewable Energy, 2016, 99:390-397.
[14] Wang B. L., Liu Z. H., Li H. Y. et al. On the numerical simulations of vortical cavitating flows around various hydrofoils [J].Journal of Hydrodynamics, 2017, 29(6):926-938.
[15] Xing T., Stern F. Factors of safety for Richardson extrapolation [J].Journal of Fluids Engineering, 2010, 132(6):061403.
[16] Roache P. J. Discussion: “Factors of safety for Richardson extrapolation” (Xing, T., and Stern, F., 2010, ASME J.Fluids Eng., 132, p. 061403) [J].Journal of Fluids Engineering, 2011, 133(11): 115501.
[17] Long Y., Long X. P., Ji B. et al. Verification and validation of URANS simulations of the turbulent cavitating flow around the hydrofoil [J].Journal of Hydrodynamics,2017, 29(4): 610-620.
[18] Guo Q., Zhou L., Wang Z. et al. Numerical simulation for the tip leakage vortex cavitation [J].Ocean Engineering,2018, 151: 71-81.

- 水動力學(xué)研究與進(jìn)展 B輯的其它文章
- Numerical simulation of wave-current interaction using the SPH method *
- The influence of perforated plates on wave transmission and hydrodynamic performance of pontoon floating breakwater *
- Pressure characteristics of hydrodynamic cavitation reactor due to the combination of Venturi tubes with multi-orifice plates *
- Transport feasibility of proppant by supercritical carbon dioxide fracturing in reservoir fractures *
- Effect of blade shape on hydraulic performance and vortex structure of vortex pumps *
- Interaction between surface gravity wave and submerged horizontal flexible structures *