
Application of QPSO-KM Algorithm in Wine Quality Classification
2015-12-14 08:31:44JingQIUWanyunPENGRuiwuWUHaitaoZHANG
Jing QIU, Wanyun PENG, Ruiwu WU, Haitao ZHANG
1. Teaching Affairs Office, Yunnan Agricultural University, Kunming 650201, China;
2. College of Plant Protection, Yunnan Agricultural University, Kunming 650201, China;
3. College of Foundation and Information Engineering, Yunnan Agricultural University, Kunming 650201, China
Wine quality assessment is usually carried out by liquor assessment professionals.Based on the scores of various indicators, the quality of wine is determined.However, wine quality is closely related to brewing grape and physical and chemical indicators and aromatic compounds of wine. The establishment of an effective and practical wine classification model is of great significance in objective classification of wine. Many scholars have conducted researches on wine quality classification, and they have made certain achievements, such as neural networks[1], K-means[2], Copula function[3]and least-squares support vector machine[4]. In this study, the wine quality classification model was established using the QPSO-optimized KM algorithm in order to achieve better classification results.
Algorithm Analysis
Quantum particle swarm optimization (QPSO) has strong global search capability, and it is able to find the optimal solution in the whole feasible space. KM algorithm is a divisionbased algorithm, and it finds the optimal clustering results through constantly updating cluster centers of iteration. In order to obtain better clustering results, improve the running speed and avoid local optimal solutions, how the QPSO and KM algorithms are to be effectively combined is still unknown.In the optimization of KM algorithm using QPSO algorithm, the key is to find an organic combination point.Thus the K means can be updated using local and global optimal positions.When the QPSO falls into local optimal position, the KM algorithm can be introduced to improve convergence speed and global search performance.The fitness function is as follows:
In the formula (1), n represents the number of wine samples; xirepresents the jthclass of wine; cijrepresents the ith particle velocity.The specific algorithm is as follows: ①Population initialization. When the population is initialized, n wine samples are first sampled as the cluster centers. Subsequently, the values of all types of cluster centers are calculated. Thenumber of iteration is maximized, and the particle velocity is initialized.N represents the population size; pi represents the optimal position of particle within a particle swarm; pg represents the global optimal position. ②According to the number of iterations, the shrinkage and expansion coefficients are adjusted. ③According to the fitness function,the fitness value of each particle is calculated. Based on the comparison between fitness value and experienced fitness value, the optimal positions of particle and particle swarm are decided to be adjusted.④According to the evolution equation of QPSO,the particle velocity and local and global optimal positions are adjusted.⑤The distances between each wine sample and the cluster centers are calculated.Based on the minimum distance,the wine sample is re-classified.Thus the wine samples are all classified into their nearest classes. ⑥In accordance with the clustering principles, the new cluster centers are arranged. The classification is ended if the cluster centers show the best fitnesses. If not, the classification is restarted from step ②. The global optimal clustering results are outputted.
Experiment and Discussion
Data processing
The wine samples included 27 red wine samples and 28 white wine samples. Their scores were given by the liquor assessment professionals.Moreover, the physical and chemical indicators and aromatic substances of each wine sample were also obtained.
The connections between brewing grape quality and physical and chemical indicators of wine were analyzed.Since many physical and chemical indictors are associated with brewing grape quality, a few comprehensive indicators were screened out using principal component analysis. The screened indicators could basically reflect the information of all the previous indicators. According to the theory of principal component analysis, if the cumulative contribution of the first R principal components reaches 85% ,the R principal components are considered to be capable of reflecting enough information.
As shown in Table 1, there were total 17 principal components reflecting the quality of brewing grape, including total phenols, tannins, anthocyanins, DPPH radical, protein, soluble solids, solid-acid ratio, VC content,total flavonoids, resveratrol, limonene,3-methyl-1-butanol, diethyl succinate,ethyl acetate, ethanol, 3-methyl-1-butanol-acetate and benzyl alcohol.
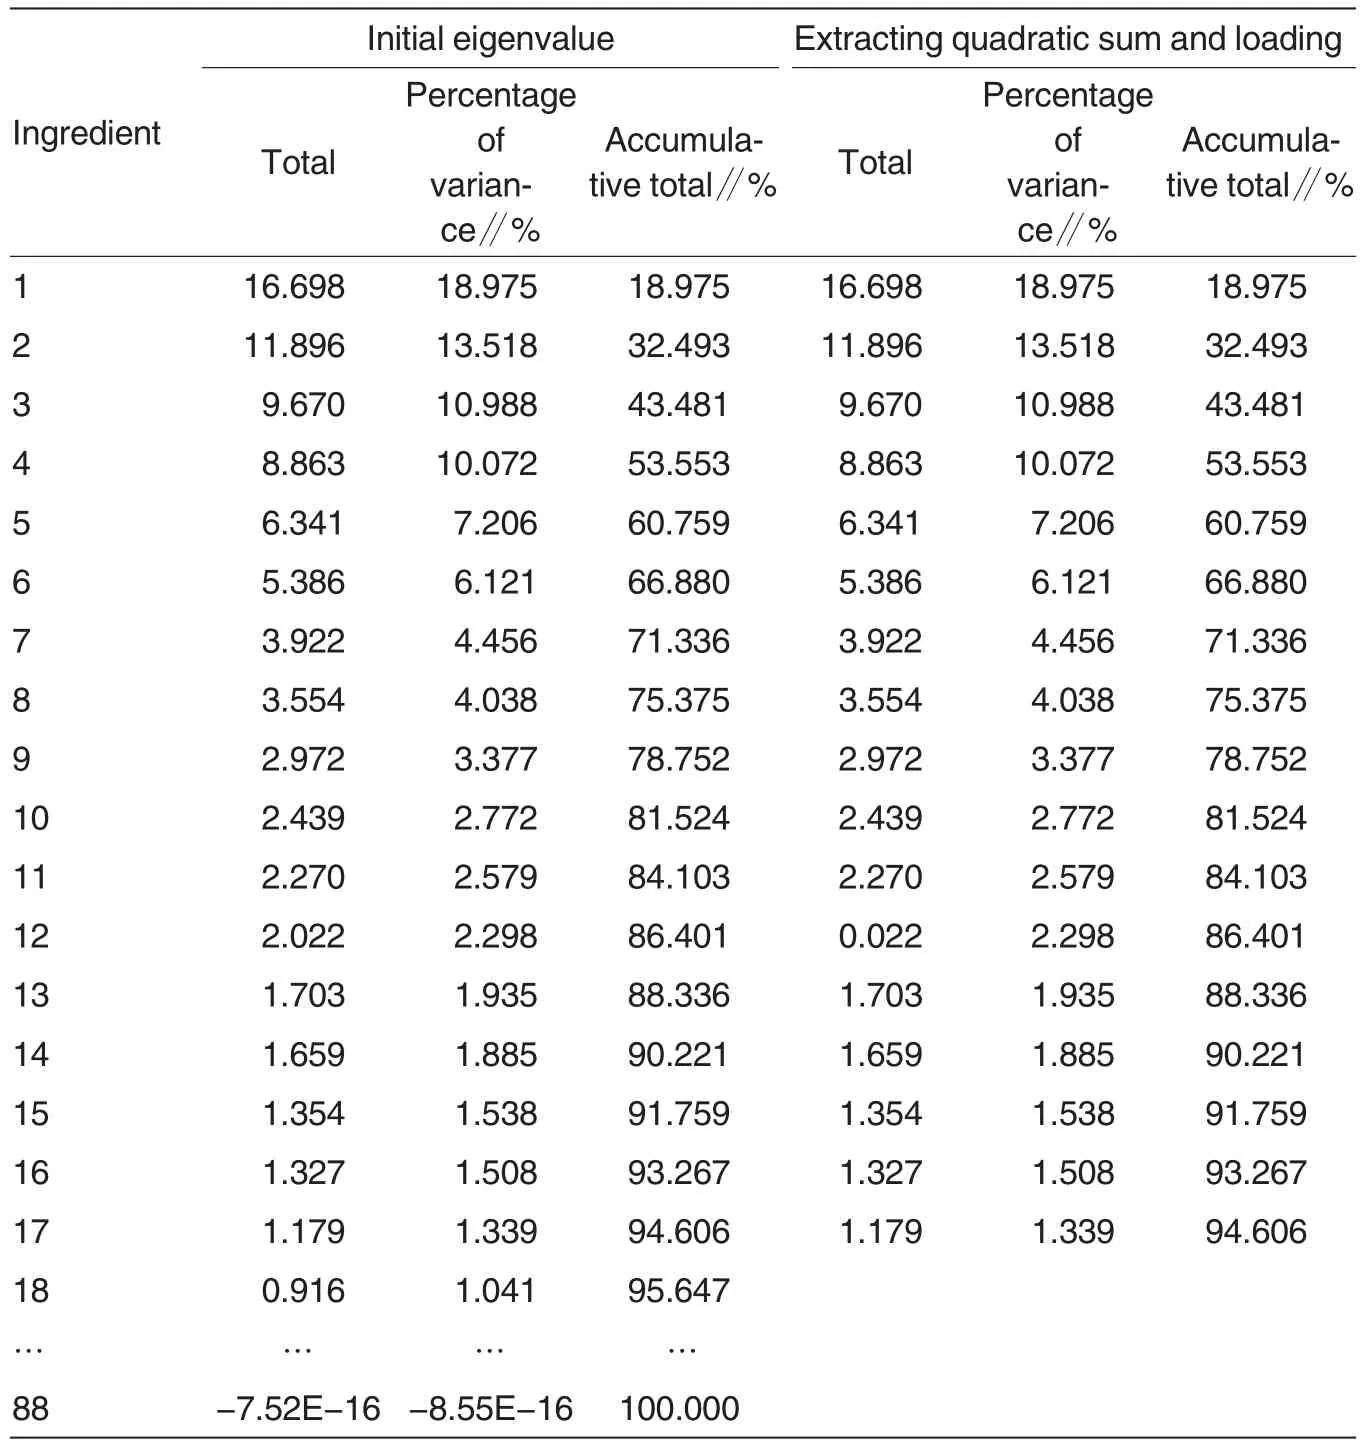
Table 1 Characteristic roots and corresponding contributions of various physical and chemical indicators of wine
Difference test
The assessment results of the second group of liquor assessment professionals on wine samples were different, so this could be transformed into multi-factor variance analysis without repetition. The factors included group,liquor assessment professional,wine sample and assessment result.The groups were represented by 1 and 2;the liquor assessment professionals were represented by 1, 2, 3, …, 20;the red and white wine samples were numbered uniformly, and the red wine samples were represented by 1-27,and the white wine samples were represented by 28-55.
The non-repeated observation and non-interaction variance analysis was performed using SPSS 19.0. Total four factors were taken into accounted, including group, liquor assessment professional, wine sample and assessment results. The analysis results were shown in Table 2.
As shown in Table 2, between groups, F=5.289 and P=0.022 <0.05,indicating that there were significant differences in assessment results between the two groups of liquor assessment professionals.
Table 3 showed that the standard error of the second group is smaller than the first group,so the assessment results of the second group of liquor assessment professionals were more credible.
The credibility of assessment scores of certain liquor assessment professional could be assessed by variance analysis. For each indicator,the quadratic sum of errors between assessment scores of certain liquor assessment professional and average assessment scores of all liquor assessment professionals in a group could be calculated. The larger thevariance was,the greater the instability was. Thus the assessment scores were less credible.The overall sample variance was calculated as follows:
In the formula (2), S2represents the overall sample variance; i represents the number of wine samples; j represents certain liquor assessment professional (j=20); k represents certain indicator(k=10);xijkrepresents the score of kthindicator of ithwine samplejthliquor assessment professional;represents the average score of kthindicator of ithwine sample by total 10 liquor assessment professionals.
Based on the assessment data of each liquor assessment professional,the quadratic sum of errors between assessment scores of each liquor assessment professional and average assessment scores of all liquor assessment professionals in a group was calculated(Table 4).
As shown in Table 4, the overall sample variances of red wine, white wine and red & white wine of the second group were all lower than those of the first group.So the assessment results of the second group were more stable than those of the first group,and they were also more credible.
Combining the results of Table 3 and Table 4, in the practice, the assessment results of the second group of liquor assessment professionals were adopted to determine the quality of wine samples.
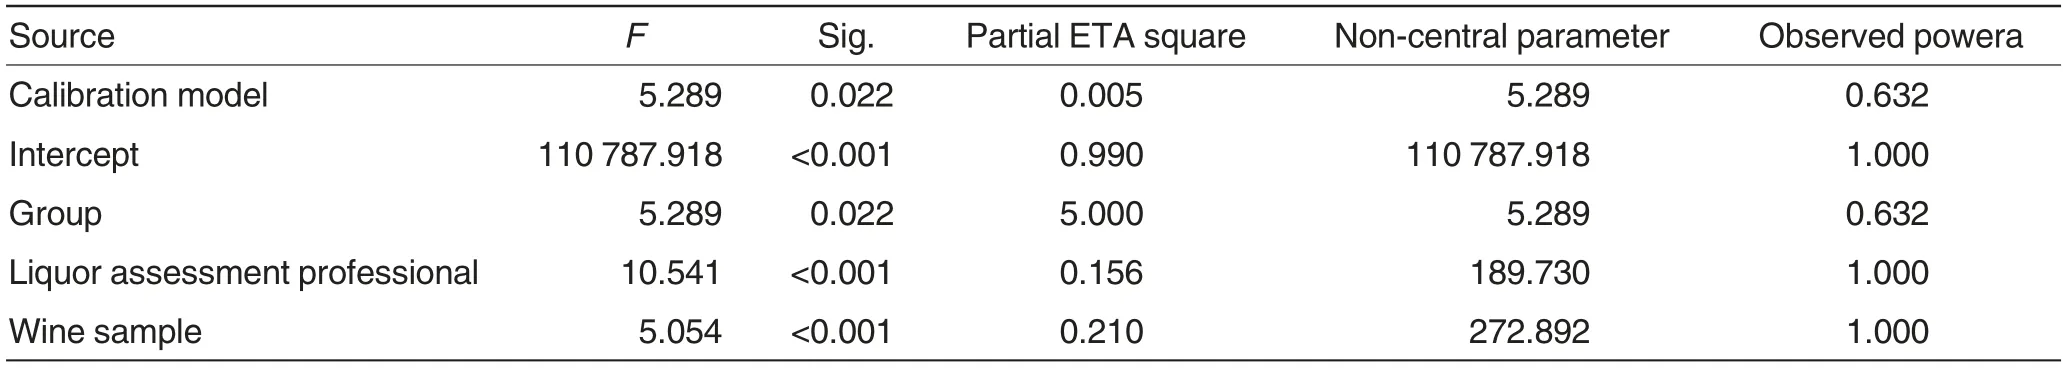
Table 2 Analysis of evaluation results

Table 3 Standard errors of evaluation data
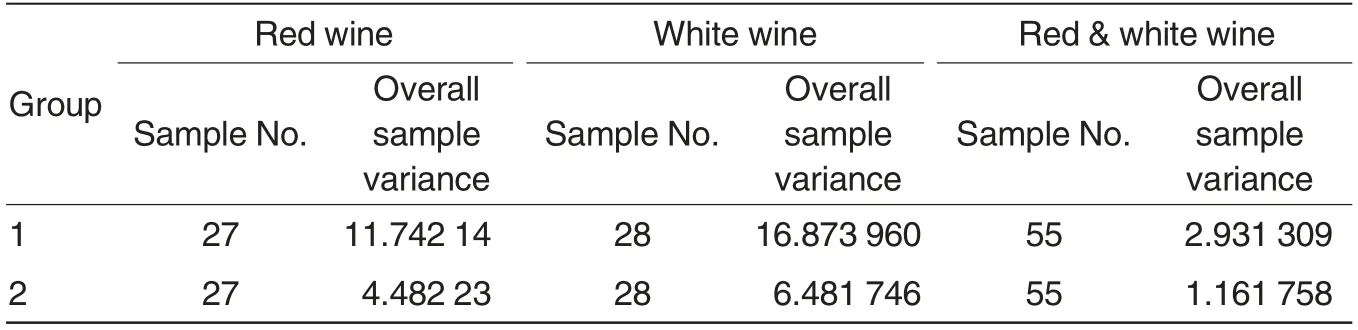
Table 4 Comparison of overall sample variance between the two assessment groups
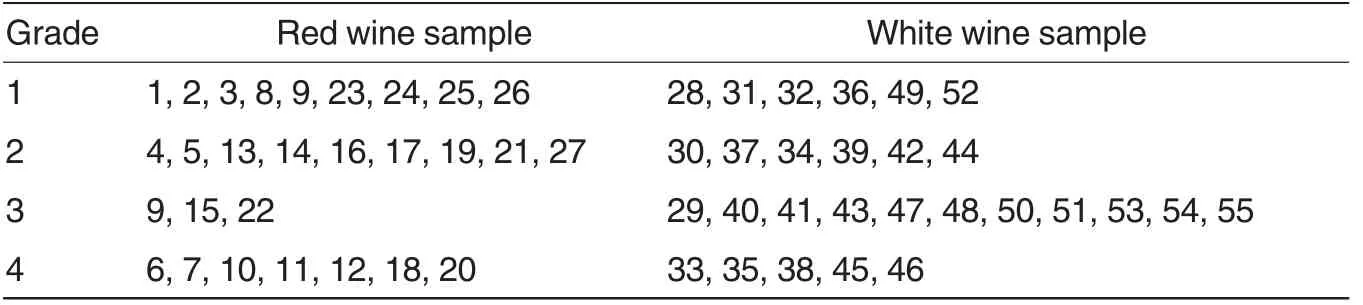
Table 5 Classification results of wine samples
Classification of wine samples
According to the established wine quality classification model using QPSO-KM algorithm and screened physical and chemical indicators and aromatic substances using principal component analysis,the classification tests of red and white wine were carried out combining the assessment results of the liquor assessment professionals.
In the red wine classification test,the number of population was 27, and the particle length was 17 (physical and chemical indicators and aromatic substances influencing the quality of wine). The number of iterations was 500, and the learning rates C1=0.8,C2=1. The weighting coefficient ω was decreased linearly from 0.8 to 0.3.The test was repeated 100 times, and the final results were expressed as means.The comparison among different algorithms was shown in Fig.1.
Fig.1 showed that the fitness value of the QPSO-KM algorithm was significantly lower than those of the other two algorithms, but the iteration number of the QPSO-KM algorithm was significantly higher than those of the other two algorithms. It suggests that the QPSO-KM algorithm is more capable of searching optimum solutions in the global space, and it is not easy to fall into local extrema. The classification results of the wine samples using the QPSO-KM algorithm were shown in Table 5.
Conclusions
Using the QPSO-optimized KMalgorithm, the wine quality classification model was established. The experimental analysis showed that the fitness value of QPSO-KM algorithm was significantly lower than those of the other algorithms,solving the shortcoming of PSO’s easy to fall into local extrema. Moreover, the classification results of the red and white wine samples using the QPSO-KM algorithm were more credible. It suggests that QPSO-KM is an effective and feasible algorithm in wine classification, and it is also a better clustering method.
[1]ZENG XY(曾祥燕), ZHAO LZ(趙良忠),SUN WB (孫文兵), et al. Prediction model of quality of wine on principal component analysis and BP neural networks (基于PCA 和BP 神經(jīng)網(wǎng)絡(luò)的葡萄酒品質(zhì)預(yù)測(cè)模型)[J]. Food and Machinery(食品與機(jī)械),2014,30(1):40-44.
[2]LING J(凌佳),YAN FR(言方榮). Application of K-means clustering in wine classification(K 均值聚類(lèi)在葡萄酒分級(jí)中的應(yīng)用)[J]. Journal of Food Science and Technology(食品工業(yè)科技),2013,34(6):104-107.
[3]LING J(凌佳),YAN FR(言方榮).Application of Copula function in wine classification(Copula 函數(shù)在葡萄酒分級(jí)中的應(yīng)用) [J]. Liquor-Making Science &Technology (釀酒科技), 2013, 226(4):57-60.
[4]WU RH (吳瑞紅), WANG YL (王亞麗),ZHANG HC(張環(huán)沖),et al.An evaluation model of wine quality based on least square support vector machine(一種基于最小二乘支持向量機(jī)的葡萄酒品質(zhì)評(píng)判模型)[J].Journal of Huaqiao University (Natural Sciences) (華僑大學(xué)學(xué)報(bào):自然科學(xué)版),2013,34(1):30-35.
猜你喜歡
基層中醫(yī)藥(2021年3期)2021-11-22 08:08:04
收藏界(2018年3期)2018-10-10 05:34:08
電子測(cè)試(2017年15期)2017-12-18 07:19:27
中國(guó)醫(yī)療保險(xiǎn)(2017年6期)2017-07-18 11:28:19
中國(guó)商界(2017年4期)2017-05-17 04:36:48
中國(guó)衛(wèi)生(2016年5期)2016-11-12 13:25:50
智能系統(tǒng)學(xué)報(bào)(2015年4期)2015-12-27 09:38:39
中國(guó)衛(wèi)生(2015年10期)2015-11-10 03:14:22
中國(guó)衛(wèi)生(2015年6期)2015-11-08 12:02:44
電子設(shè)計(jì)工程(2015年6期)2015-02-27 12:04:53
 Agricultural Science & Technology2015年9期
- Agricultural Science & Technology的其它文章
- Evaluation on Suitability of Camellia sinensis Planting Based on GIS
- Light Quality-controlled Phytochemicals Biosynthesis in Vegetables and Fruits
- Cloning and Characterization of Phytochrome A Gene FaPHYA from Tall Fescue
- Genetic Analysis of Embryo Production Frequency in Wheat×Maize Cross
- The Application Effects of Truly Biodegradable Mulch in Potato Farmlands
- The Analysis and Prospect of Development of Fresh Cut Flower Industry Based on the Patent Analysis