
Research on Simulation of Non-point Source Pollution in Qingjiang River Basin Based on SWAT Model and GIS
2010-11-12 11:19:06WANGZhaohuiZHAODengzhongCAOBoLIANGDongye
長江科學(xué)院院報 2010年1期
WANG Zhao-hui,ZHAO Deng-zhong,CAO Bo,LI ANG Dong-ye
(1.Yangtze River Scientific Research Institute,Wuhan 430010,China;2.School of Resource and Environmental Science,Wuhan University,Wuhan 430010,China)
1 INTRODUCTION
With rapid change and economic development,particularly in the densely populated and economically developed regions of the middle reach of Yangtze River Basin,dramatic pollutant loadings have deteriorated river water quality.Though point source pollution controlling has achieved outstanding results,there are still serious problems because the non-point source(NPS)pollution accounts for a large part of water pollution.Many researches in different countries have proved that NPSpollution was oneof the main reasons deteriorating water quality.Finding out the effect of NPS pollution has instructive significance on sustainable water resource development and water quality management in Yangtze River Basin.
Hydrologic models are useful tools for understanding and analyzing watershed hydrologic parameters'change processes,interactions,testing research hypotheses,and assessing management scenarios[1].The soil and water assessment tool(SWAT)is a model developed by Dr.Jeff Arnold for the USDA-ARS(agricultural research service),which is based on physics and presents continuous time.It is mostly used to predict impact of land management practices on water,sediment,and nutrient yields over long periods of time[2].
This model has been widely used.The SWAT is probably attributed to the comprehensive considerations of hydrologic,biological and environmental processes,the incorporation of management scenarios,the availability of parameter databases,and its robustness,flexibility,as well as user friendliness.Heuvelmans presented a discussion in model parameter transferability for simulating the impact of land use on catchments hydrology[3].While the SWAT is widely applied to a broad range of conditions,however,a few studies have reported on the variability and transferability of the model parameters,and on evaluation of its crop growth,soil water,and groundwater modules using extensive field experimental data at the process scale[4].
In this paper,the Qingjiang River Basin,a main branch of middle Yangtze River Basin,is selected as a research area.Water discharge and pollutant loadings are simulated based on SWAT model to reconstruct river nutrients evolution.The critical risk areas of soil erosion are identified.According to the simulation results,soil erosion moduli are calculated in each subbasin and soil erosion intensities are classified.Stream flow and nutrient loadings(including total nitrogen(TN)and total phosphorus(TP))in Qingjiang River Basin are simulated.
2 STUDY AREA DESCRIPTIONS
Qingjiang River Basin lies in the middle reach of Yangtze River Basin,near the Three Gorges Project,approximately between 29°33′-30°50′N and 108°35′-111°35′E.It is a mother river with long history of peopleliving and agricultural development.The famous Tujia Nationality lives in this area.The terrain of Qingjiang River Basin is intensely fluctuated,from the west high mountains and hills to the east low altitude(Fig.1).Climate is warm and wet,it belongs typically subtropical monsoon climate.The average annual temperature is 15-16℃,and average annual precipitation and evaporation are 1460mm and 600-800mm respectively.The basin is covered naturally by evergreen and deciduously broad-leaved,mixed forest.Three major soil types are found in the basin including red-yellow soil,yellow cinnamon soil and paddy soil.
3 DATA AND METHODS
3.1 Data description
The data for SWATinclude a land use database,a soil map,digital elevation model data(DEM),a digital river network and aclimate database.The scale of DEM data is 1/50 000,and mesh size is 25 m×25 m.In order to eliminate the errors of river network extracted from DEM data,the digital river network is revised by water system maps in scale of 1/10 000[5].Besides the DEM data,all the other data are projected to a 25 m×25 m grid data under the same reference frame.
3.2 Simulation methods
The first level of sub-division in SWATis sub-basin which contains at least one hydrologic response unit(HRU),a tributary channel and a main channel or reach.HRUs possess unique land-use,management and soil attributes.
During the simulation based on SWAT,the whole Qingjiang River Basin was divided into fifteen sub-basins,and every sub-basin was composed of many HRUs.Before simulation,parameter sensitivity analysis were conducted,the sensitive parameters of SWAT model were identified,and then model parameters related to stream flow and nutrient loadings were calibrated and validated by observed values.
In order to research the impacts of nutrient loadings caused by human activities,nutrient loading were simulated from year 1980 to 2005.NPSpollution distribution and critical risk areas of soil erosion and nutrient loss were identified.The spatial-temporal distribution features of NPSpollution in the Qingjiang River basin were revealed.
4 PARAMETERS SENSITIVITY ANALYSIS
In this study,parameter sensitivity was analyzed by LH-OAT method proposed by Morris in SWAT model.The advantages of method one-factor-at-a-time(OAT)and the method Latin-Hypercube are extracted and adopted by the method LH-OAT[6].The merits of LH-OATmethod are that it lessens the range of parameters,decreases the number of parameters being adjusted and improves the efficiency of simulation.
The purpose of conducting sensitivity analysis for all parameters is to understand the influences of the ten top parameters on stream flow,sediment,total phosphorous and total nitrogen in order(seen in Tbale 1).Because model calibration and validation depend on the actual physical process,these listed parameters were acted as reference from observed values.
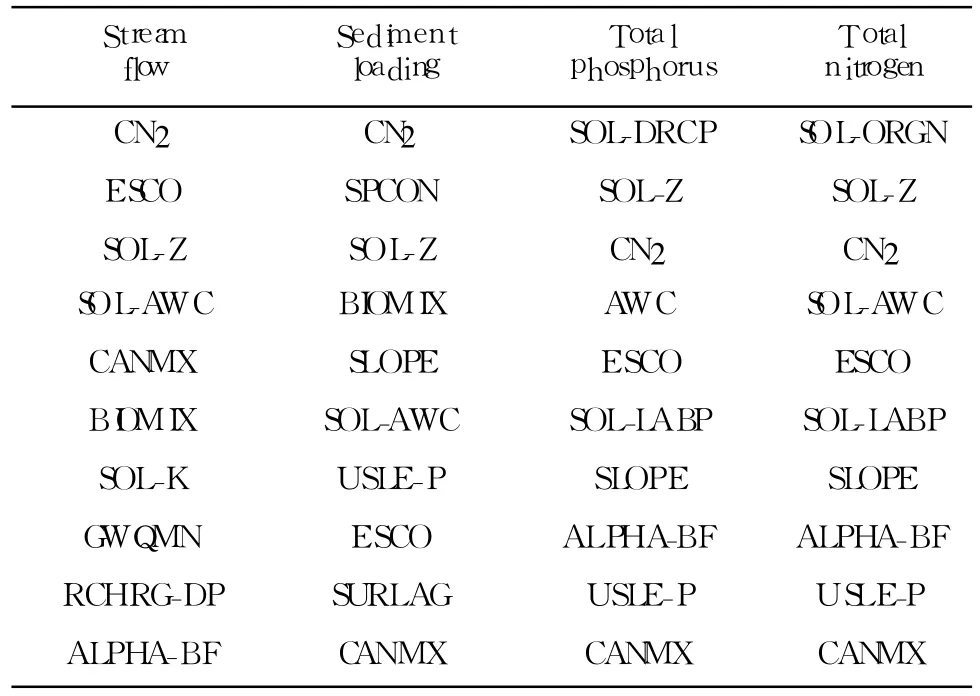
Table 1 The results of parameter sensitivity analyses
5 MODEL CALIBRATION AND VALIDATION
The aim of model calibration and validation is to find out the parameter value which coincides with simulated datum and observed value.It is indispensable for simulation,which is used to assess model predicted results[7].Observed data from three stations including Shuibuya Station,Geheyan Station and Changyang Station were used in this research.Only data of Changyang Station were used to calibrate and validate sediment and nutrition because of observed data in the absence of former two stations.
In this study Nash-Sutcliffe coefficient(ENS)and correlation coefficient were adopted in model calibration and validation.In comparson simulated values with observed values,if a reasonable stream flow was achieved,same parameters were used for calibration of the sediment and nutrient yield.The Nash-Sutcliffe coefficient and correlation coefficient reached 0.81 and 0.991 respectively in flow simulation.The Nash-Sutcliffe coefficient and correlation coefficient reached 0.752 and 0.964 respectively in sediment simulation.The Nash-Sutcliffe coefficient and correlation coefficient of nutrient calibration both reached satisfied value using the same method.
6 ANALYSIS AND DISCUSSION
6.1 Identification of the critical risk areas of soil erosion
Soil erosion quantity was calculated in each subbasin.According to the simulated results of the soil erosion based on SWAT model during 1980-2005,soil erosion intensities were classified,and spatial distribution characters were revealed.The simulation results showed that the area of low-grade soil erosion accounted for 68.87%,that of middle-grade soil erosion 26.74%and that of drastic soil erosion 4.39%.(Fig.2).

Fig.2 The distribution of soil erosion critical risk area
The result shows that there are intimate relationships between soil erosion,precipitation,slope length and slope gradient[8],that the relative coefficient between soil erosion and precipitation is 0.59,and that the relative coefficient between soil erosion and slope length is 0.23,while the coefficient between soil erosion and slope gradient is 0.39.
6.2 Simulation on stream flow
The simulated average annual stream flow was 1.57×10¹⁰m3·yr-1from 1980 to 2005(Fig.3).The maximum runoff occurred in 1983,following with 1998,viz.2.46×1010m3and 2.39×10¹⁰m3respectively.The minimum stream flow was in 1997,viz.1.03×1010m3.

Fig.3 Simulated stream flow during 1980-2005
The annual stream flow mainly occured from May to September,which was 61.3%of the whole year.Simulation results indicate that the maximum flow occurred in August(Fig.4).

Fig.4 Simulated monthly output changes of stream flow during 1980-2005
6.3 Simulation on changes of TP and TN
Average annual nutrient outputs of TN and TP were 1.559×10⁶kg and 1.56×10⁵kg respectively.Seasonal variations of the nutrient output were different.The result of 1980 is not included in Table 2 because its values are abnormal.

Table 2 Simulated changes of TN and TP from 1981-2005(105 kg)
The concentration and output of TN and TP changed according to season transformation.The maximum output of TN and TP occured in late spring and summer(from April to September)(Fig.5),the minimum output occured in winter.There are two reasons for this phenomenon.The most important one is agricultural tillage operation,such as cultivation and fertilizing in spring[9].The other one is temperature.Grass and leaves are rotted rapidly in higher temperature,which makes water carry plenty of pollutants and enhances nutrient loadings[10].
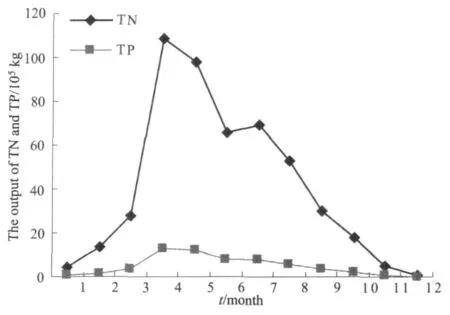
Fig.5 Simulated monthly output changes of TN and TP during 1980-2005
7 SUMMARY AND CONCLUSION
Although the SWAT model is commonly used in simulation on stream flow,sediment and nutrient loadings,it is influenced not only by natural conditions such as precipitation,soil type and topography but also human activities.Land use,tillage operation and precipitation are the main reasons influencing surface runoff and nutrient concentration and output.The outputs of nutrient loadings are in accordance with tillage operation and fertilizer application seasons.
In Qingjiang River basin the area of low-grade soil erosion accounted for 68.87%,that of middle-grade soil erosion 26.74%,and that of drastic soil erosion 4.39%respectively.The average annual stream flow was 1.57×10¹⁰m3· yr-1from 1980 to 2005.Stream flow mainly distributed from May to September,which owns 61.3%of the whole year.The average annual output of TN and TPwere 1.559×10⁵kg and 1.56×10⁶kg respectively.The surface runoff and nutrient yield result indicates that the averageannual runoff and output of TN and TP provides better understanding in streamflow and nutrient loadings corresponding to variations of land use conditions,agricultural tillage operation and natural rainfall etc.
[1]LUO Yi,HE Chan-sheng,SOPHOCLEOUS Marios,et al.Assessment of crop growth and soil water modules in SWAT2000 using extensive field experiment data in an irrigation district of the Yellow River basin[J].Journal of Hydrology,2008,352:139-156.
[2]GEZA Mengistu and McCray J E.Effects of soil data resolution on SWAT model stream flow and water quality predictions[J].Journal of Environmental Management,2008,88:393-406.
[3]XU Z X,ZHAOF F,LI JY.Responseof stream flow to climate change in the headwater catchment of the Yellow River Basin[J].Quaternary International,2008:1-14.
[4]HOLVOET K,VAN Griensven A,SEUNTJENSP,et al.Sensitivity analysis for hydrology and pesticide supply towards the river in SWAT[J].Physics and Chemistry of the Earth,2005,30:518-526.
[5]CHAPLOT V.Impact of DEM mesh size and soil map scale on SWAT runoff,sediment,and NO3-N loads predictions[J].Journal of Hydrology,2005,312:207-222.
[6]SHEN Zhen-yao,HONGQian,YUHong,et al.Parameter uncertainty analysis of the Non-point source pollution in the daning river watershed of the Three Gorges Reservoir Region[J].Science of the Total Environment,2008,405:195-205.
[7]NINGA Shu-Kuang,CHANG Ni-Bin,JENGCKai-Yu,et al.Soil erosion and Non-point source pollution impacts assessment with the aid of multi-temporal remote sensing images[J].Journal of Environmental Management,2006,79:88-101.
[8]WANG Zhao-hui,CHEN Bei-qing,CHENG Xue-jun.Impact of land use change on Non-point Source Pollution Load in Changyang County[J].JOURNAL of Yangtze River Scientific Research Institute,2010,27(1):17-21.
[9]Trancoso Ana Rosa,Braunschweig Frank,Leitao Pedro Chambel,et al.An advanced modelling tool for simulating complex river systems[J].Science of the Total Environment,2009,407:3004-3016.
[10]TANGA Z,ENGELA B A,PIJANOWSKIB B C,et al.Forecasting land use change and its environmental impact at a watershed scale[J].Journal of Environmental Management,2005,76:35-45.

- 長江科學(xué)院院報的其它文章
- 空間信息技術(shù)在水政監(jiān)察執(zhí)法中的應(yīng)用研究
- A Rapid and Accurate Computation Method of Three Gorges Reservoir Dynamic Storage
- ArcGISServer應(yīng)用開發(fā)中的數(shù)據(jù)優(yōu)化策略
- GIS技術(shù)在突發(fā)性水污染事件應(yīng)急響應(yīng)系統(tǒng)中的應(yīng)用研究
- 大范圍地形及工程三維系統(tǒng)快速搭建方法
- Perpendicular Drought Index and its Application in Hubei Zhanghe Irrigation System