
Improved Mixed Integer Optimization Approach for Data Rectification with Gross Error Candidates*
2009-05-12 03:33:02LIJianlie李筧列andRONGGang榮岡
LI Jianlie (李筧列) and RONG Gang (榮岡)
?
Improved Mixed Integer Optimization Approach for Data Rectification with Gross Error Candidates*
LI Jianlie (李筧列) and RONG Gang (榮岡)**
State Key Laboratory of Industrial Control Technology, Institute of Cyber System and Control, Zhejiang University, Hangzhou 310027, China
Mixed integer linear programming (MILP) approach for simultaneous gross error detection and data reconciliation has been proved as an efficient way to adjust process data with material, energy, and other balance constrains. But the efficiency will decrease significantly when this method is applied in a large-scale problem because there are too many binary variables involved. In this article, an improved method is proposed in order to generate gross error candidates with reliability factors before data rectification. Candidates are used in the MILP objective function to improve the efficiency and accuracy by reducing the number of binary variables and giving accurate weights for suspected gross errors candidates. Performance of this improved method is compared and discussed by applying the algorithm in a widely used industrial example.
data rectification, gross error detection, graphic theory, Bayesian method
1 INTRODUCTION
In most chemical plants, measurement error will lead to poor decisions in the regular plant activities such as planning and process optimization. After the idea of data reconciliation was brought in 1961 [1], the problem of improving the accuracy of process data to let them satisfy the material, component, and energy balance with less adjustment and shorter time has been studied for decades. Besides the widely used solution of linear and nonlinear problem using matrix projection [2, 3], many other methods such as mixed integer linear programming (MILP) method [4], principal component analysis (PCA) method [5], measurement test and node test (MTNT) method [6-8], and redundancy analysis method [9] have been developed to solve the steady-state data rectification problem. More information about the history of data rectification methods can be obtained from a perspective written by Crowe [10].
MILP framework of simultaneous data reconciliation and gross error detection is prompted to remove random errors of plant data, as well as identify and compensate gross errors for the final solution. MILP method defines an associated binary variable for each measurement to indicate the existence of gross error and add penalty in the objective function to activate the binary variables. However, the efficiency will decrease significantly when the method is applied to large-scale problems, as there will be too many binary variables in the calculation. Fortunately, we found that before performing the mixed integer linear optimization, the number of binary variables can be reduced on the basis of historic data. Moreover, accurate weighting factors in the objective function should also improve the results.
This article describes a method for searching gross error candidates in a directed diagram of process flowsheet and calculating their reliability factors. The gross error candidates are used to decide binary variables in the MILP objective function.
2 BASIC MILP METHOD
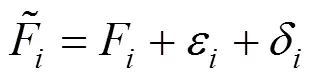
For a linear, time invariant, and steady state system such as a network of flow rate, balance equation can be written as:


The MILP method is derived from the standard formulation of data reconciliation:
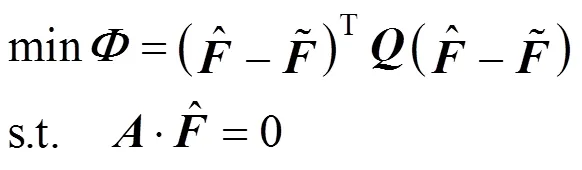
By substituting the Eq. (2) into Eq. (3) and defining each measurement a binary variable corresponding to the existence of a bias, the new objective function with MILP formulation can be written as:
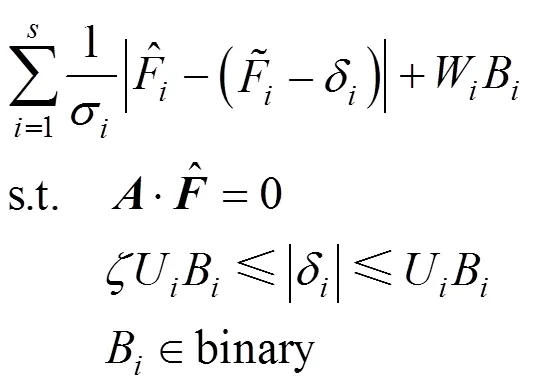

Figure 1 Spanning trees for a simple flowsheet
3 GENERATION OF GROSS ERROR CANDIDATES
Because the data reconciliation and gross error detection problems are formulated as MILP frameworks, it is easy to apply other techniques to enhance the performance. Soderstrom suggests using some standard statistical tests for bias as constrains; however, these modifications not offer much benefits over the basic method. And moreover, as an optimization problem, this technique is significantly more computationally intensive. Generate a list of gross error candidates and reduce the binary variables in the objective function is obviously an efficient way to improve the efficiency of the MILP method.
In order to generate gross error candidates with weighting factors and reduce the binary variables in the objective function, an efficient method based on graphic theory and Bayesian method is prompted. This method can generate gross error candidates with prior information and cost less computation time.
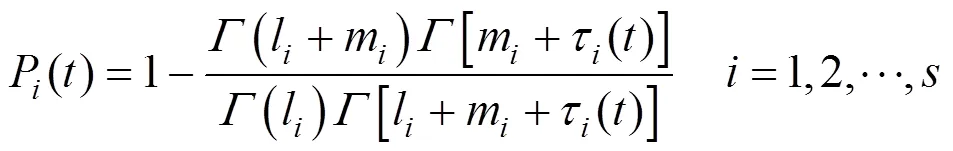
Tamhane. [11, 12] used Bayesian approach to detect gross error in which the prior probabilities of gross error occurrence are updating in the light of accumulating data. And the probability of gross error occurrence for instrument is:
Once the prior probabilities are confirmed, the next step is to use these probabilities to generate gross error candidates before using the MILP method. This step can be modified or even removed when there are expert experiences or no accumulated process data. Experts can determine the prior probabilities by checking the quality of process data or starting with same prior probabilities and allowing these values to be updated in the next iteration.
In the view of graphic theory, the flowsheet can be regard as a directed graphic. As illustrated in Fig. 1, spanning tree is the subgraph of a graphic, and this subgraph does not contain any loops. So the streams in the flowsheet can be divided into two sets: branches and chords of the spanning tree. Obviously, the true value of every branch can be obtained through true values of some chords. For example, the branches of spanning tree No.1 in Fig. 1 is stream 2, 3, and 4, so the chords will be stream 1 and 5. So the true value of stream 2 and stream 4 is as same as the true value of stream 1, and true value of stream 3 is identical to the sum of true values of stream 1 and stream 5. In this case, we called these chords as independent variables (IV) and branches as dependent variables (DV).
Usually, there are a large number of spanning trees in a given graph, so the choice of independent variables is not exclusive. In this method, because the independent variables are used as benchmarks in the gross error candidate generation, we choose the chords of graph’s maximal spanning tree as independent variables. And the weight of the given flowsheet is defined as prior probabilities calculated by Eq. (5).


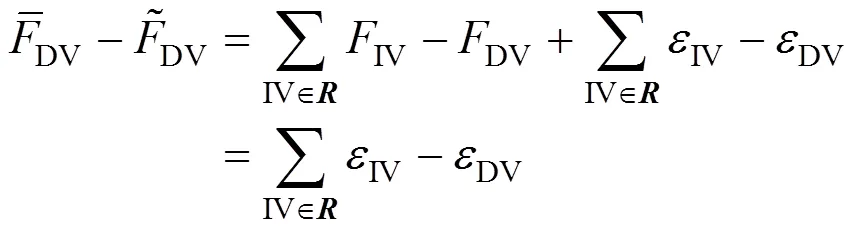

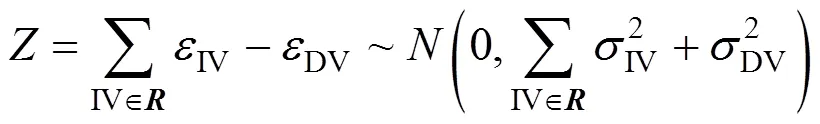
Statisticis established to indicate the measurement bias for dependent variables that has an upper threshold limit ofZfor a level of significance
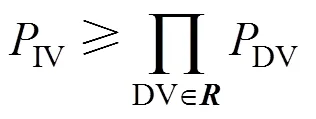
There is a remaining problem that independent variables have certain probabilities to include gross error and cause the type I error of gross error candidates in the dependent variables. In order to solve this problem, if an independent variable contains gross error, we assume that all the dependent variables corresponding to this independent variable will be suspected. The probability of gross error occurrence between this independent variable and all the corresponding dependent variables will be compared to decide the gross error candidate. Assume that the probability of gross error occurrence is 0.2 for streams 2, 3, 4, and 0.1 for stream 1 in Fig. 1. If streams 2, 3, and 4, which are corresponding to stream 1, are suspected with gross errors, stream 1 will be added into gross error candidate list because the probability of all streams 2, 3, and 4 that contain gross errors will be 0.23, which is smaller than the probability of gross error occurrence for stream 1. Once there are candidates in the independent variables, all dependent variables not in the candidate list will be removed from graph and new iteration will be performed in the subgraph till there are no new gross error candidates in the subgraph. Details of the gross error candidate generation method are described as follows:
Step 1 Weight all measured streams with their probability of gross error occurrence calculated by Eq. (5).
Step 2 Finding the maximal spanning tree of the graph (subgraph), classify the streams into independent and dependent variables.

Step 5 Merge all nodes without any inner gross error candidates to generate subgraph then go to Step 2.
4 APPLY CANDIDATES IN THE MILP METHOD
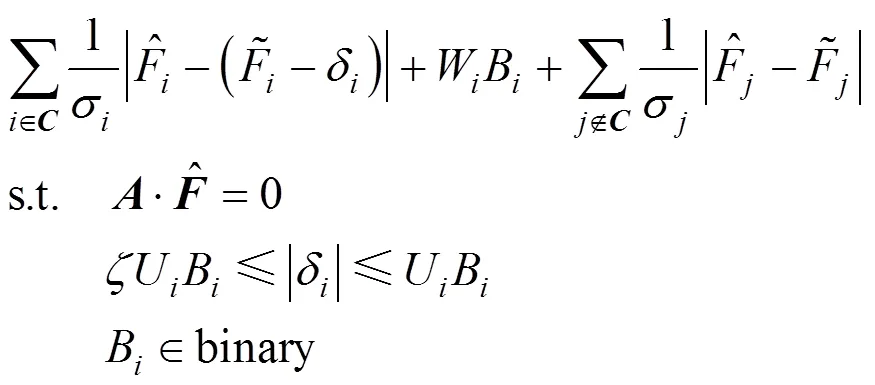
Gross error candidates generated in the last section will be introduced into Eq. (4) to improve its calculation efficiency. This step is accomplished by removing the binary variables in Eq. (4) that represent the streams not in the candidates. And the problem can be represented as:
When there are equivalent sets in the detected biases, the updated weighting factors can be used further to output suspect biases with higher probabilities. This strategy can be regarded as the utilization of both spatial and temporal redundancy of the measurement network. In order to understand this method easily, a flow chart that represents the improved method is shown in Fig. 2.
Figure 2 Flowchart of the improved method
5 SIMULATION STUDY
The system chosen for study was an industrial steam metering process [13]. And this system was also used for comparison in many other gross error detection methods [14]. The system used for simulation is illustrated in Fig. 3, and the true flow rates can be found in Table 1.

Table 1 True values for the flow rates in steam metering process
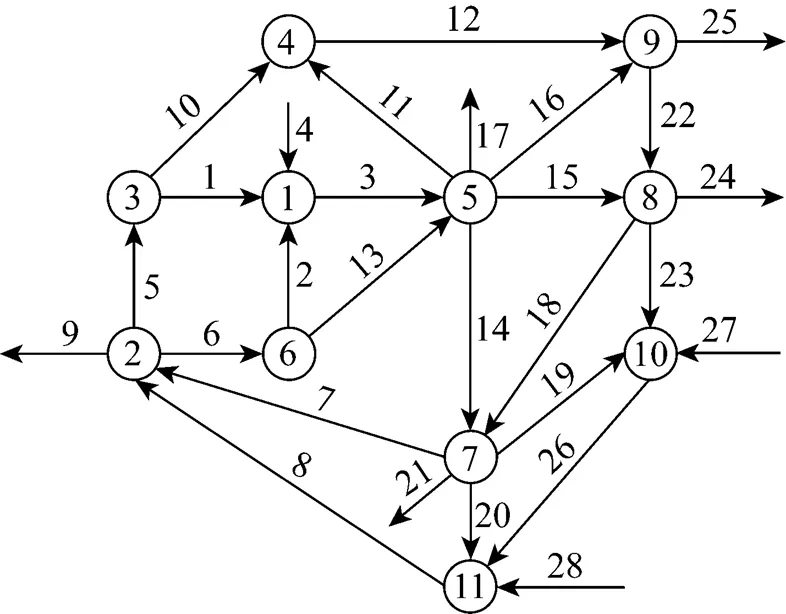
Figure 3 System of steam metering process

Average number of type I error (AVTI) and overall power (OP) [15] were applied to evaluate the performance of the improved method. The criteria are defined as follows:
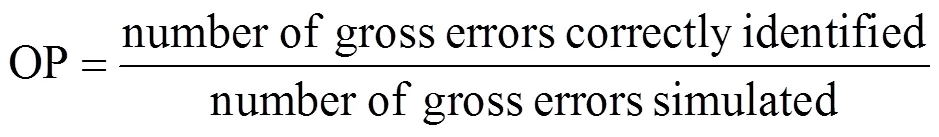

Both OP and AVTI are calculated after 100 simulation runs in different conditions.
Several interesting comparison can be made by checking the simulation results presented below. One of these is the influence of choosing more reliable independent variables. In the simulation trials, the number of higher weight bias is set as 0,1/3,2/3,1 times of number of the random selected biases. Higher the weight (prior probability of gross error occurrence) the stream has, less probability that this stream will be chosen as independent variable. Nearly all the OP is increased together with the number of higher weight bias, whereas the AVTI remains at the same level. When all biased streams are weighted with higher value, the OP increases significantly. But it is rare that all the biased streams have higher weights; however, the result seems acceptable when few biased streams are given higher weights. Fig. 4 and Fig. 5 show that good results can be obtained by fewer high weight biased streams.
Table 2 Results for the improved method ()

Figure 4 Influence of high weight biases percentage on overall power◆?3 biases; ■?5 biases;▲?7 biases
Figure 5 Influence of high weight biases percentage on average type I error◆?3 biases; ■?5 biases;▲?7 biases
Table 3 indicates the simulation results for this method and other widely used gross error detection methods. Under most situations, performance measures of improved method (IMILP) are higher than modified iterative measurement test (MIMT) [13], modified simultaneous estimation of gross error (MSEGE), and serial identification with collective compensation (SICC) [17]. The result clearly shows that when historical data are used to evaluate the prior probability of gross error occurrence, the identification of gross errors is more accurate than just using statistical methods. However, when there are no historical data can be used to calculate prior gross error occurrence, the performance of improved method are also better than the original MILP method because the binary variables are significantly reduced.
The number of the dependent variables is equal to the number of branches in the flowsheet, so the relationship between number of dependent variable (DV); the number of independent variables (IV); and the total number of the measurements () are:
When the independent variable has bigger, the bias in the streams with small true value might be ignored in the candidate generation. This problem may be improved by adjusting the weights of streams with small(increase a little to raise the probability of being independent variable). Once the equivalent set exists because the candidate streams form a loop in the graph representing the flowsheet [16], a solution can be used by updating weights to give gross error candidates with larger probabilities.
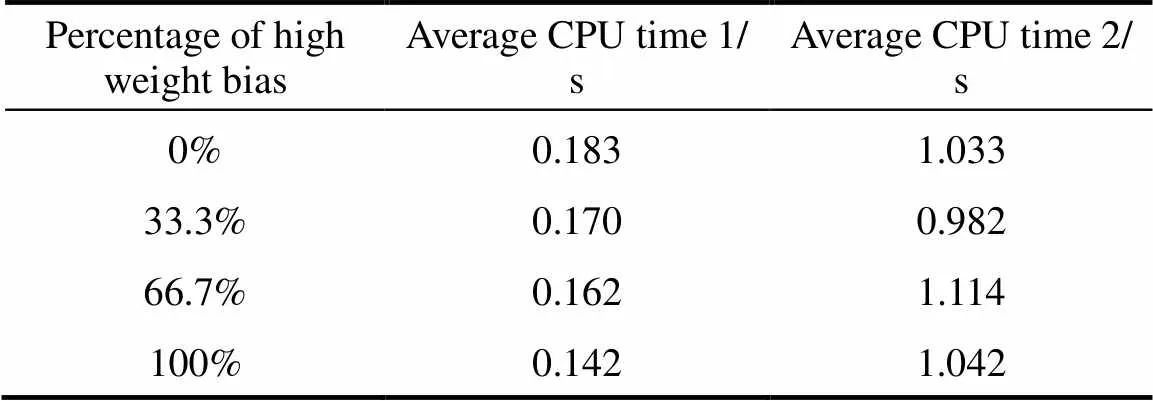
Simulation time of different conditions is presented in Table 4. The results show that the solution time of gross error candidate generation (Average CPU time 1) is rather limited.
The solution time (Average CPU time 2) is increased due to the increase in the number of biased streams. And the trend is opposite when the percentage of high weight biases is increased.
Table 3 Performance comparison ()
6 CONCLUSIONS
This article proposes an improved MILP method for simultaneous gross error detection and data reconciliation. The data reconciliation and gross error detection based on the framework of MILP has a great advantage of process system integration in process industry. Because the planning/scheduling are normally solved under the framework of MILP or mixed integer nonlinear programs (MINLP), it will be much more convenient to integrate data rectification into the refinery manufacturing execution system than other methods. Effective gross error candidate generation method is applied before using the original mixed integer linear programming. Performance and comparison show that choosing reliable independent variables can improve the accuracy of measurements within a short period of time. Also, this method was found to have better performance over the original MILP method and other commonly used methods. Reduction of binary variables in the objective function leads to a superior improvement of the calculation efficiency. This improvement makes the MILP method more suitable for the application in large-scale process industries.
NOMENCLATURE
constraint matrix
acorrelative parameter
binary variable
set of gross error candidates
true flow rate
number of previous failure
sum of previous lifetimes
DVnumber of dependent variables
IVnumber of independent variables
number of process nodes
set of independent variables used to estimate the dependent variable
number of streams
weighting factor
1 Kuehn, D.R., Davidson, H., “Computer control (II) Mathematics of control”,, 57 (6), 44-47 (1961).
2 Crowe, C.M., “Reconciliation of process flow rates by matrix projection (II) Nonlinear case”,., 32 (4), 616-623 (1986).
3 Crowe, C.M., Campos, Y.A.G., Hrymak, A., “Reconciliation of process flow rates by matrix projection (I) Linear case”,., 29 (6), 881-888 (1983).
4 Soderstrom, T.A., Himmelblau, D.M., Edgar, T.F., “A mixed integer optimization approach for simultaneous data reconciliation and identification of measurement bias”,, 9 (8), 869-876 (2001).
5 Tong, H., Crowe, C.M., “Detection of gross erros in data reconciliation by principal component analysis”,., 41 (7), 1712-1722 (1995).
6 Wang, F., Jia, X.P., Zheng, S.Q., Yue, J.C., “An improved MT-NT method for gross error detection and data reconciliation”,..., 28 (11), 2189-2192 (2004).
7 Yang, Y., Ten, R., Jao, L., “Study of gross error detection and data reconciliation in process industries”,..., 19 (Suppl), S217-S222 (1995).
8 Mei, C., Su, H., Chu, J., “An NT-MT combined method for gross error detection and data reconciliation”,...., 14 (5), 592-596 (2006).
9 Zhang, P., Rong, G., Wang, Y., “A new method of redundancy analysis in data reconciliation and its application”,..., 25 (7/8), 941-949 (2001).
10 Crowe, C.M., “Data reconciliation—Progress and challenges”,, 6 (2/3), 89-98 (1996).
11 Tamhane, A.C., Iordache, C., Mah, R.S.H., “A Bayesian approach to gross error detection in chemical process data (I) Model development”,, 4 (1), 33-45 (1988).
12 Tamhane, A.C., Iordache, C., Mah, R.S.H., “A Bayesian approach to gross error detection in chemical process data (II) Simulation results”,, 4 (2), 131-146 (1988).
13 Serth, R.W., Heenan, W. A., “Gross error detection and data reconciliation in steam-metering systems”,., 32 (5), 733-742 (1986).
14 Rollins, D.K., Cheng, Y., Devanathan, S., “Intelligent selection of hypothesis tests to enhance gross error identification”,..., 20 (5), 517-530 (1996).
15 Narasimhan, S., Jordache, C., Data Reconciliation & Gross Error Detection, Gulf Publishing Company, Houston (2000).
16 Jiang, Q., Bagajewicz, M.J., “On a strategy of serial identification with collective compensation for multiple gross error estimation in linear steady-state reconciliation”,...., 38 (5), 2119-2128 (1999).
17 Jiang, Q., Sanchez, M., Bagajewicz, M.J., “On the performance of principal component analysis in multiple gross error identification”,...., 38 (5), 2005-2012 (1999).
2008-05-28,
2008-11-06.
the National High Technology Research and Development Program of China (2007AA40702 and 2007AA04Z191).
** To whom correspondence should be addressed. E-mail: grong@mail.hz.zj.cn
 Chinese Journal of Chemical Engineering2009年2期
- Chinese Journal of Chemical Engineering的其它文章
- Kinetics of Reactive Extraction of Nd from Nd2O3 with TBP-HNO3Complex in Supercritical Carbon Dioxide*
- Activity Coefficient Models to Describe Vapor-Liquid Equilibrium in Ternary Hydro-Alcoholic Solutions*
- Position Group Contribution Method for Predicting the Normal Boiling Point of Organic Compounds
- Experimental Study on the Initial Position Distribution of Taylor Bubbles in Cryogenic Upward Inclined Tubes*
- Enhancement of Proton Exchange Membrane Fuel Cell Performance Using a Novel Tapered Gas Channel*
- Tert-butylation of Toluene with Tert-butyl Alcohol over Realuminated H-mordenite Zeolite*